. 2017 Feb 21;8(5):3500–3511. doi: 10.1039/c6sc03738k

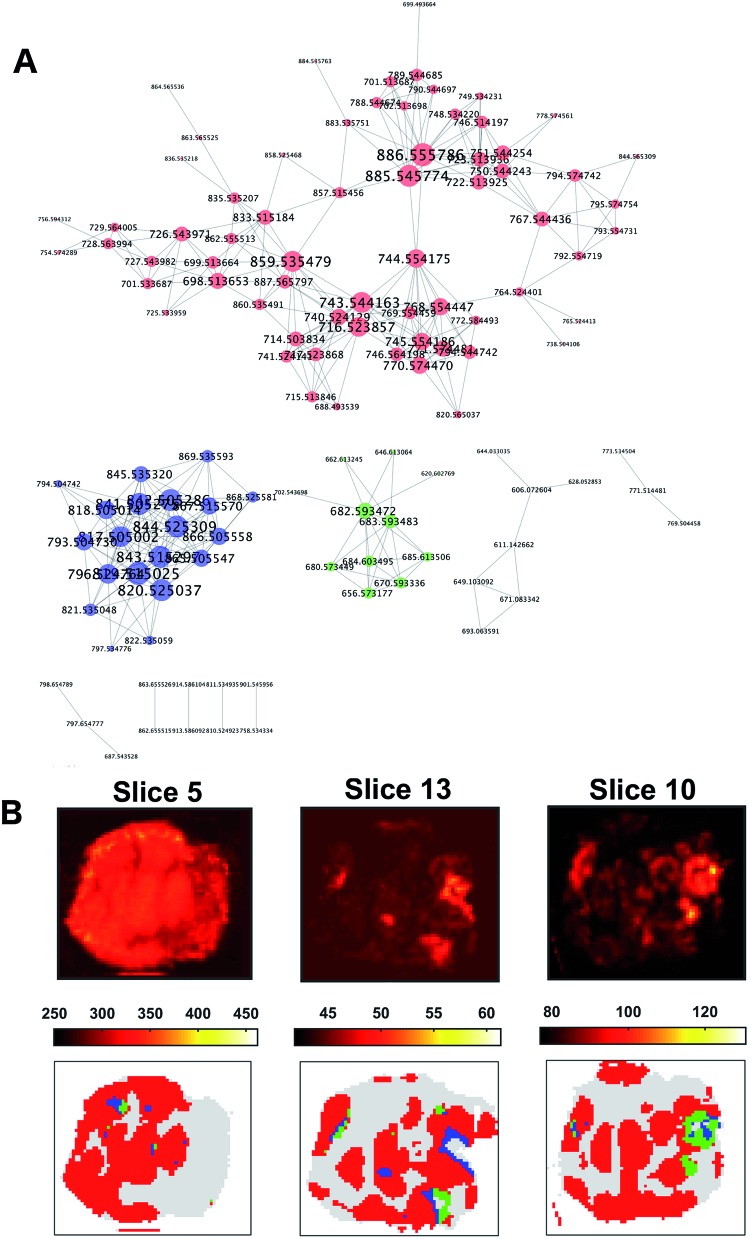
Fig. 6. Co-expression network for ion vectors of tumour mass spectra showing 10 disconnected sub-networks (A). Nodes with a degree larger than two are labelled with the relative m/z value in Da. Larger nodes are characterised by a higher degree. The three largest sub-networks are coloured in red, blue and green respectively. The corresponding SSI images showed a spatial distribution compatible with that of the OPTICS clusters (B). The SSI image of the ions from the sub-network 1 (A, red) were compatible with the cluster 1 (B, red), whereas sub-network 2 (B, blue) was compatible with cluster 2 (B, blue), and ions from sub-network 3 (A, green) were similarly distributed to cluster 3 (B, green).

Fig. 6