Figure 3.
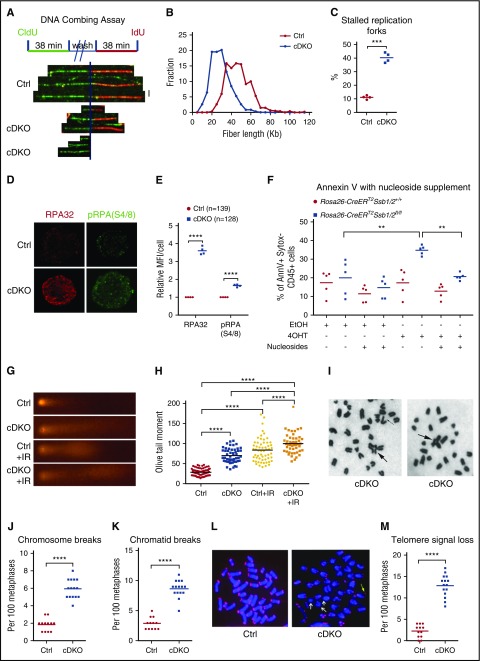
Replication stress and genomic instability in cDKO HSPCs and BM. (A-C) DNA fiber assay on HSPCs. (A) LKS+ cells were isolated on day 2 after 4 mg of TAM, cultured for 16 hours, and sequentially pulsed with 2 different thymidine analogs, CldU and IdU. Replication fork movement was measured by incorporation of CldU (green) and IdU (red). (B) Distribution of red fiber length of ongoing forks. At least 300 structures were measured per sample per experiment, and quantification on 4 independent experiments was presented. (C) The frequency of terminated fibers that did not incorporate the second label in at least 300 structures per sample per experiment from 4 independent experiments. (D) Representative images of immunofluorescent staining of RPA (red) and phosphorylated RPA (S4/8) (green). Images were acquired at ×100 magnification. (E) Quantification of relative mean fluorescence intensity (MFI) from 4 independent experiments. Each data point represents the relative MFI in cDKO HSPCs normalized to that in Ctrl HSPCs. The n represents total number of cells. (F) EmbryoMax nucleoside supplement or vehicle (dH2O) was added to Hoxb8-immortalized cells with indicated treatment. Annexin V was analyzed for apoptotic cell death 5 days after in vitro 4OHT induction of cDKO. AnnV, annexin V. (G-H) Alkaline comet assays on LKS1 cells (G) and olive tail moment (H) from indicated groups before or at 1 hour after 2 Gy of ionizing radiation. Each point represents an individual cell from pooled biological replicates from 4 independent experiments. (I-M) Bone marrow metaphase spreads on day 3 after 4 mg of TAM. Representative images for Giemsa (I) and telomere FISH staining (L), chromosome aberration (J-K), and telomere signal loss (M) analysis are shown. Radial chromosomes, chromosomal breakages, and telomere signal loss are indicated by arrows. Images were acquired at ×63 magnification. Each point represents a biological replicate. Statistical analysis represents t test or 1-way ANOVA for 2 or multiple groups, respectively. See also supplemental Figure 3. **P < .01; ***P < .001; ****P < .0001.

