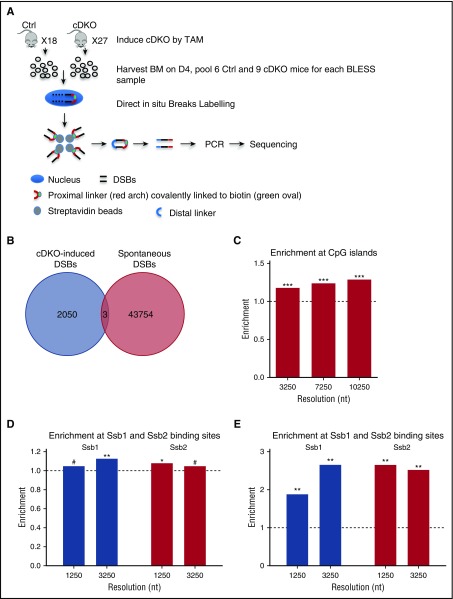
Figure 6.
Enrichment of CpG islands and tRNAs in cDKO-induced breaks and all DSBs in cDKO BM. (A) Experimental scheme of BLESS analysis to map genome-wide DSBs. From pooled BM samples of Ctrl and cDKO mice on day 4 after 4 mg of TAM, intact nuclei were purified, and DSBs were ligated to a biotinylated linker (proximal). Genomic DNA (gDNA) was extracted and fragmented, and labeled fragments were captured by streptavidin and ligated to a secondary linker (distal), PCR amplified, and sequenced. (B) Venn diagram showing regions with cDKO-induced DSBs (BLESS cDKO vs BLESS Ctrl) and spontaneous DSBs (BLESS Ctrl vs gDNA Ctrl) with a P value threshold P < .001 and 1250-nt resolution. (C) Enrichment of CpG islands in cDKO-induced breaks. (D) Enrichment of Ssb1- and Ssb2-binding sites from HIT-Seq data15 in intervals enriched with DSBs from BLESS data. (E) Enrichment of CpG islands in intervals enriched with Ssb1- and Ssb2-binding sites using the same method as that in BLESS data analysis (described in the supplemental Materials and Methods). Significance of enrichment is calculated by permutation test. See also supplemental Figure 6. #Borderline significant, .05 < P < .1; *P < .05; **P < .01.

