. 2017 Mar 2;8(5):3479–3483. doi: 10.1039/c6sc05712h

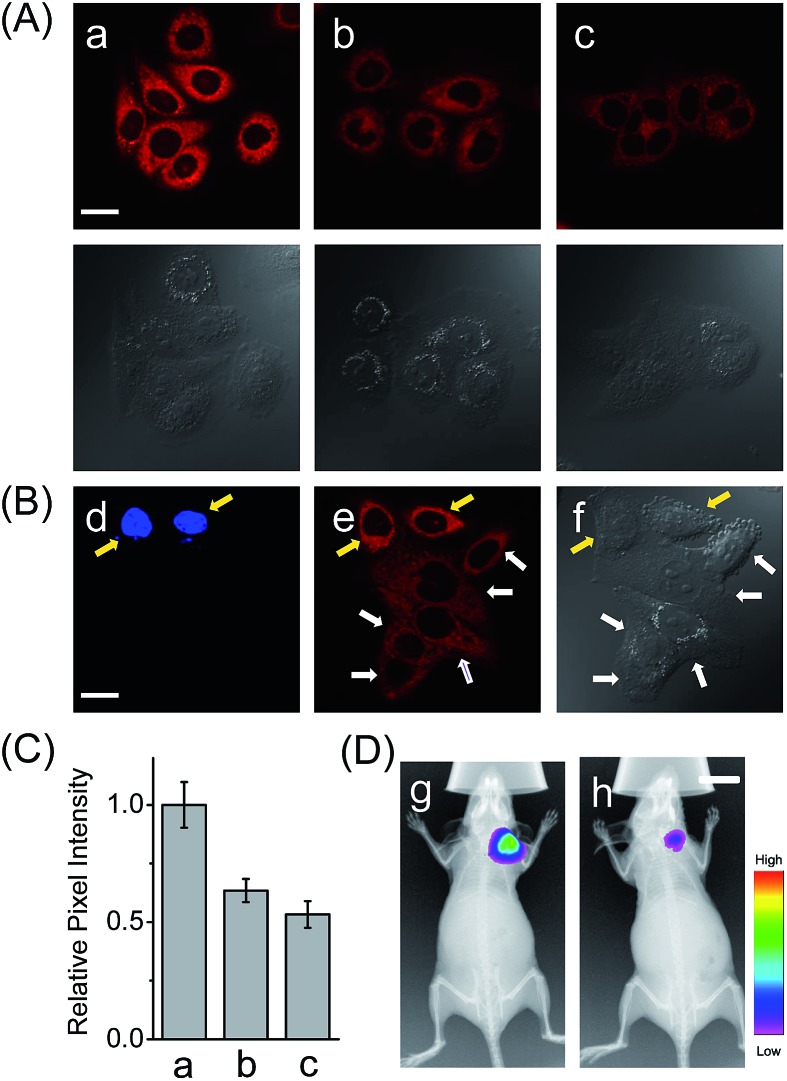
Fig. 3. (A) Confocal fluorescence images of cells with the probe HCAL. (a) HepG2 cells; (b) LO2 cells; (c) HepG2 cells pretreated with bestatin (100 μM) for 1 h. The DIC images of the corresponding sample are shown below. Scale bar: 20 μm. (B) Confocal fluorescence images of the cell mixture (LO2 and Hoechst-33342 stained HepG2 cells) with the probe HCAL. Image d: λ ex = 405 nm; image e: λ ex = 635 nm; image f: the corresponding DIC image. The yellow arrows indicate the HepG2 cells which were pre-stained with Hoechst-33342, and the white arrows indicate the LO2 cells. Scale bar: 20 μm. (C) The relative pixel intensity of the corresponding fluorescence images in panel A. (D) In vivo fluorescence imaging of HepG2 tumor xenografted mice that were intratumorally preinjected with 50 μL of (g) PBS (control) and (h) bestatin (100 μM in PBS) for 1 h before intratumoral injection of 50 μL HCAL (50 μM) in PBS. Scale bar: 1 cm.

Fig. 3