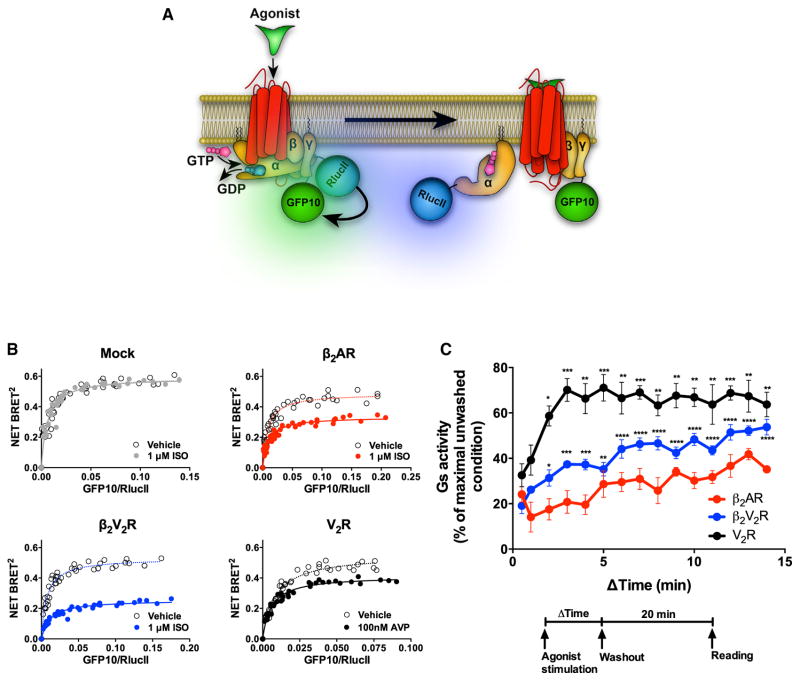
Figure 2. Sustained Gs Activation from Internalized Compartments by β2AR, β2V2R, and V2R Assessed by BRET.
(A) Schematic representation of the experimental design used to monitor agonist-promoted Gs activation, which leads to the separation of Gαs and Gβγ subunits, measured by BRET between RlucII-117-Gαs and GFP10-Gγ1.
(B) BRET titration curves obtained using a constant amount of RlucII-Gαs and with increasing amounts of GFP10-Gγ1. BRET was measured 35 min following the addition of agonist or vehicle. Data are pooled from N = 4 experiments.
(C) Relationship between the duration of agonist stimulation time and Gs activation response 20 min after agonist washout. Gs activity was determined by assessing the reduction in BRET signal between RlucII-117-Gαs and GFP10-Gγ1. Surface expression of all GPCRs was matched. Data are shown as a percent of BRET decrease observed in the unwashed condition (i.e., in the continuous presence of agonist) and represents the mean ± SE of N = 4–5 experiments. One-way ANOVA was performed to assess significant differences in Gs response by increasing agonist stimulation time versus pulse stimulation (0.5 min) (*p < 0.05; **p < 0.01; ***p < 0.001; ****p < 0.0001).
See also Figure S1.

