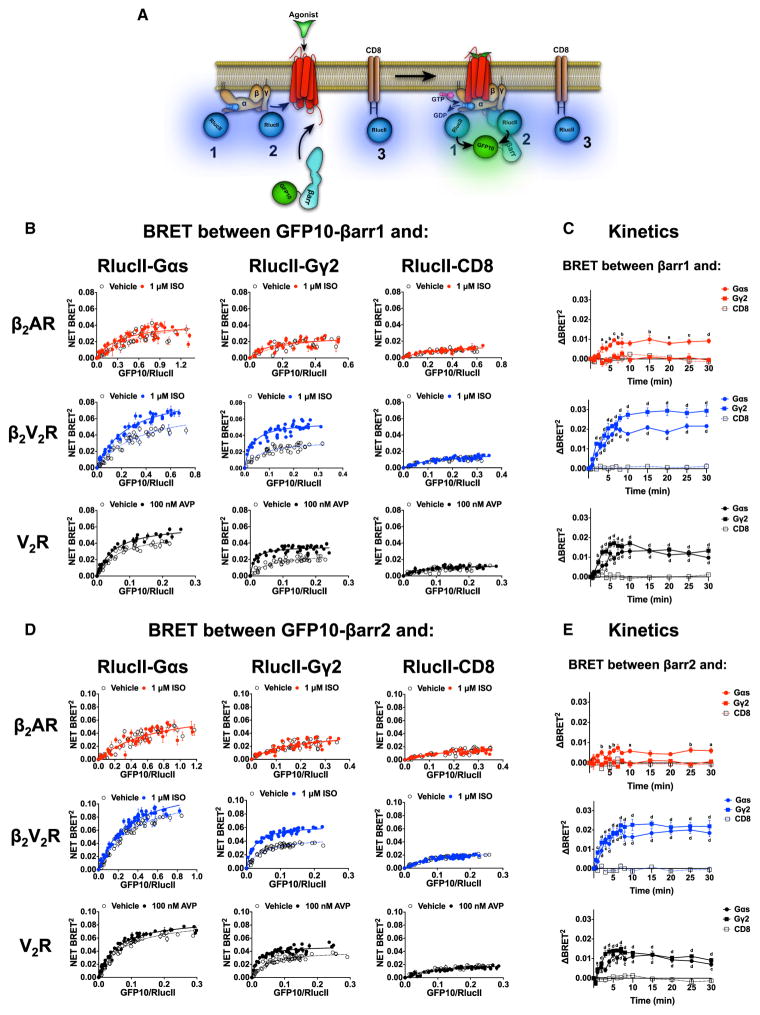
Figure 4. Interaction between βarr1/2 and Either Gαs or Gγ2 following Agonist Stimulation of β2AR, β2V2R, or V2R.
(A) Schematic representation of the experimental design used to monitor agonist-promoted BRET between RlucII-67-Gαs (1), RlucII-Gγ2 (2), or RlucII-CD8 (3) and GFP10-βarr1/2.
(B and D) BRET titration curves using a constant amount of RlucII-67-Gαs, RlucII-Gγ2, or RlucII-CD8 and increasing amounts of GFP10-βarr1 (B) or GFP10-βarr2 (D) monitored 20 min after agonist stimulation. Data are expressed as net BRET absolute values and represent the mean ± SE and are pooled from N = 3–5 experiments. Surface expression of all GPCRs was matched.
(C and E) Kinetics of agonist-promoted BRET between GFP10-βarr1 (C) or GFP10-βarr2 (E) and RlucII-Gαs, RlucII-Gγ2, or RlucII-CD8 obtained for all three GPCRs. Each kinetic point represents the mean ± SE of ΔBRET between agonist-stimulated and vehicle-treated conditions (N = 3–10 experiments). Two-way ANOVA was performed to determine significant differences between CD8 condition and Gαs or Gγ2 for each time point (a p < 0.05; b p < 0.01; c p < 0.001; d p < 0.0001).
See also Figures S1 and S5.

