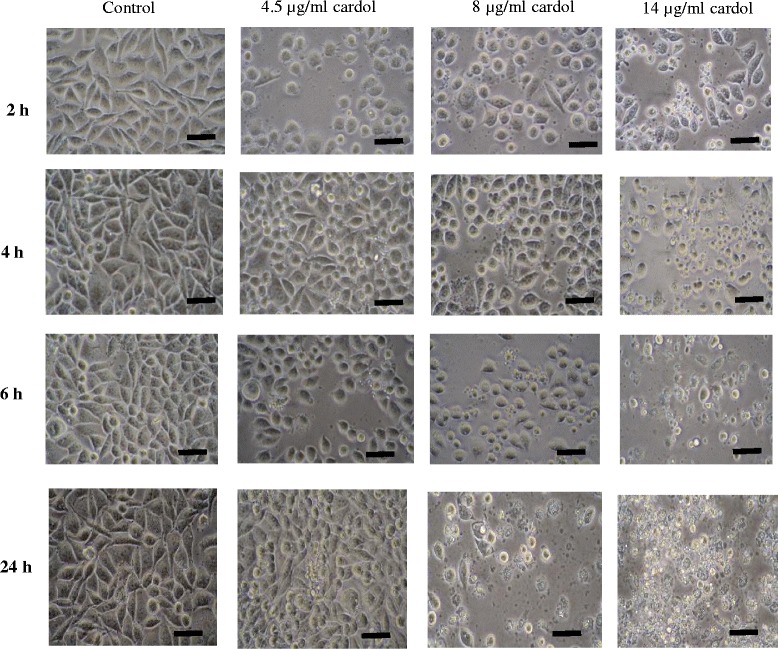
Fig. 1.

Morphology of SW620 cells at 2, 4, 6 and 24 h after treatment with cardol at 0 μg/mL (Control), 4.5 μg/mL (IC50), 8 μg/mL and 14 μg/mL. Images are at 400 x magnification and are representative of those seen from at least three such fields of view per sample and three independent repeats. Scale bar = 50 μm
