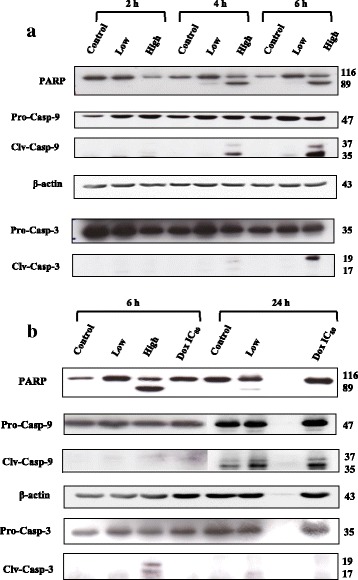
Fig. 4.

Representative western blot showing the effect on SW620 cells of cardol at 0 μg/mL (control), 8 μg/mL (Low) and 14 μg/mL (High) on caspase protein expression levels at (a) 2, 4 and 6 h after treatment and (b) compared to that with doxorubicin (Dox) at the IC80 dose (1.01 μg/mL) at 6 and 24 h after treatment. Pro- and cleaved (clv) forms of protein bands are shown. The figures are representative of five replications
