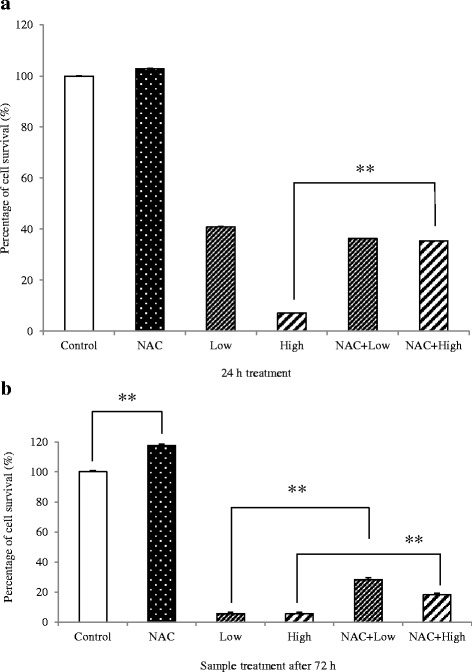
Fig. 7.

Effect of cardol at 0 μg/mL (Control), 8 μg/mL (Low) and 14 μg/mL (High), with or without 10 mM NAC, on the relative cell survival (%) after (a) 24 h and (b) 72 h exposure. A significant difference between the two indicated means (bar) is shown by ** for p < 0.01 Data are expressed as the mean ± SE, derived from three independent repeats
