Fig. 5.

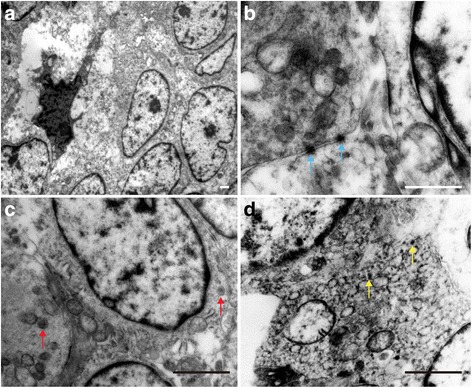
Ultrastructure analysis of the tumor. a At lower magnification, EM shows the general tumor ultrastructure. b Cell-cell gap junctions (blue arrow) were observed in some areas. c Neurosecretory granules (red arrow) were rarely seen in the tumor cytoplasm. d Glycogen granules (yellow arrow) existed in most tumor cells. All bars = 2000 nm
