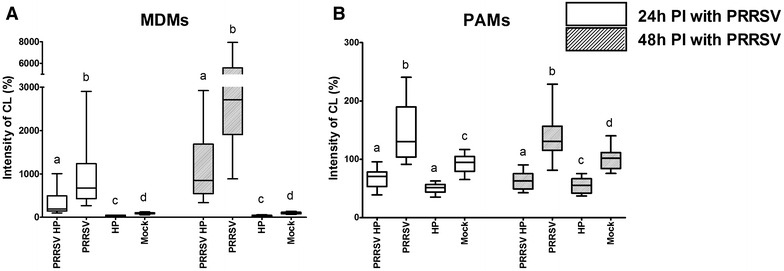
Figure 7.

ROS production. ROS produced by MDMs (A) or PAMs (B) were measured by chemiluminescence assay at 24 and 48 h PI with PRRSV. Infection with H. parasuis was performed immediately prior to measurement. Data are presented as the percentage of CL levels in non-infected control. Boxplots indicate the median (middle line), 25th and 75th percentiles (boxes), and maximum and minimum (whiskers) of five independent experiments performed in culture triplicates. Significant differences between tested groups are denoted by different letters (a, b, c, d) (p < 0.05).
