
Fig. 5.
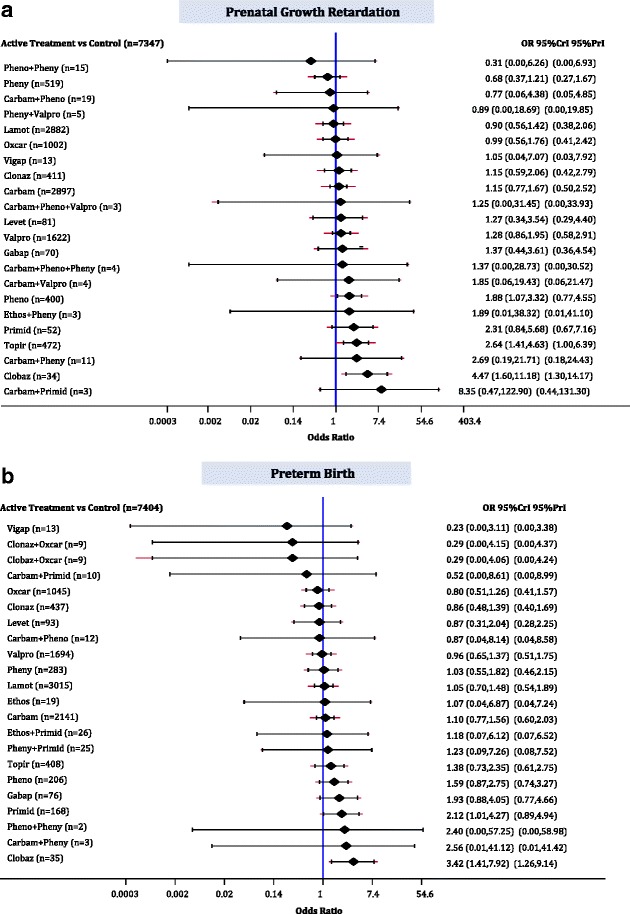
Network meta-analysis forest plots for each treatment versus control. Each rhombus represents the summary treatment effect estimated in the network meta-analysis on the odds ratio (OR) scale. The black horizontal lines represent the credible intervals (CrI) for the summary treatment effects, and the red horizontal lines represent the corresponding predictive intervals (PrI). In the absence of heterogeneity, the CrIs and PrIs should be identical. An OR > 1 suggests that control is safer, whereas an OR < 1 suggests that the comparator active treatment is safer. The vertical blue line corresponds to an OR = 1 (i.e., the treatment groups compared are equally safe). The total sample size (n) included in each treatment is also presented. a Prenatal growth retardation (16 studies, 18,177 cases, 23 treatments). b Preterm birth (17 studies, 17,133 cases, 23 treatments). carbam carbamazepine, clobaz clobazam, clonaz clonazepam, ethos ethosuximide, gabap gabapentin, lamot lamotrigine, levet levetiracetam, oxcar oxcarbazepine, pheno phenobarbital, pheny phenytoin, primid primidone, topir topiramate, valpro valproate, vigab vigabatrin