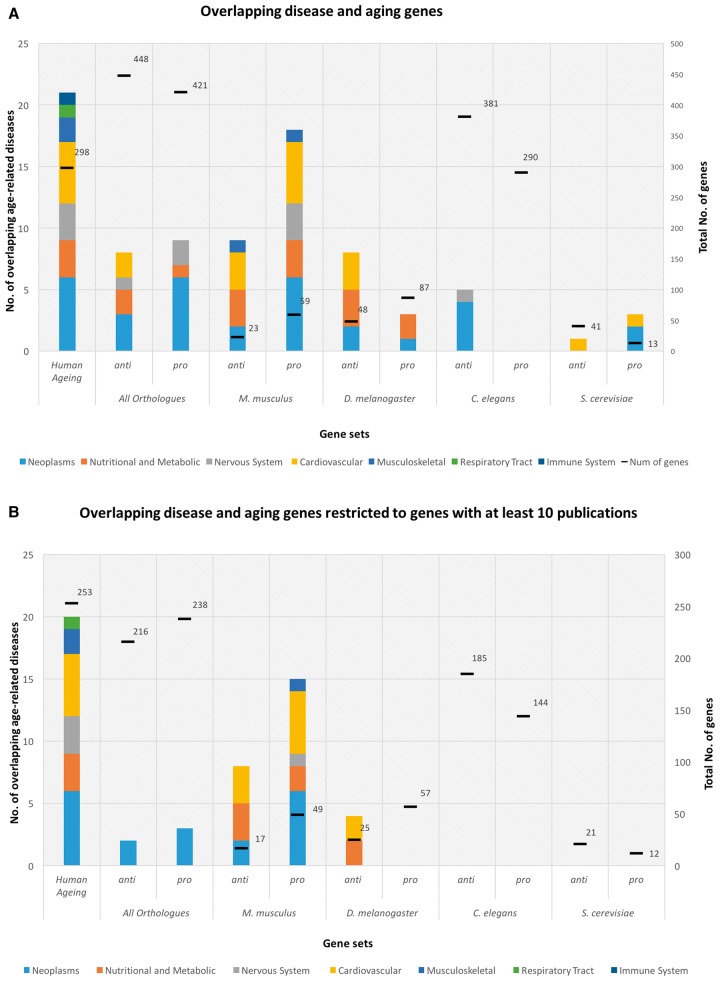
Figure 2.
The y-axis quantifies the number of age-related diseases which significantly overlap with aging-related genes; the x-axis describes the aging-related gene sets studied according to the source organism (i.e., human plus human homologs of aging-related genes from each model organism). The columns have seven different colours to represent each age-related disease classe analysed: Neoplasms (light blue), Nutritional and Metabolic diseases (orange), Nervous System diseases (light grey), Cardiovascular diseases (yellow), Musculoskeletal diseases (blue), Respiratory Tract diseases (green) and Immune System diseases (dark blue). The first column represents the number of age-related diseases with a significant overlap with candidate human aging-associated genes. Model organisms are ordered by evolutionary proximity to humans. The genome was considered as background. The secondary y-axis displays the number of genes from the respective gene sets. (A) shows the number of significant overlapping aging-related genes with age-related diseases. (B) shows the number of significant overlapping aging-related genes with age-related diseases with PBC (i.e., only genes with more than 10 publications were used).

