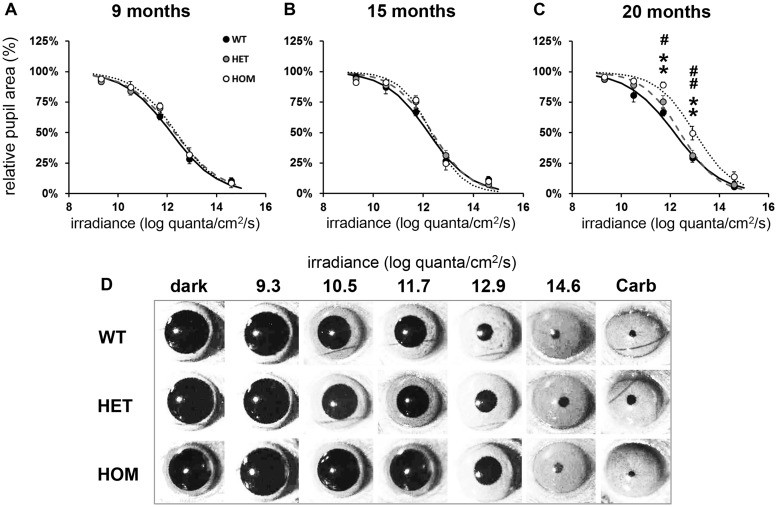
Figure 3.
Defects in pupillary responses to light in 20 month old homozygous Q175 mice. A single light exposure (10 s, 470 nm) was tested at five different irradiances (9.3, 10.5, 11.7, 12.9 and 14.6 log quanta/cm2/s) to induce consensual pupillary constriction. (A-C) Phase response curves to light irradiance are shown from wild type (WT, black symbols and solid line), Q175 heterozygous (HET, grey symbols and dashed line) and Q175 homozygous (HOM, white symbols and dotted line) mice at 9, 15 and 20 months. (D) Representative images of pupil area from Q175 and WT mice at 20 months, recorded in dark and at maximal constriction in response to a 10-s light exposure at 9.3, 10.5, 11.7, 12.9 and 14.6 log quanta/cm2/s, and 10 min after application of carbachol (Carb). All data in A-C are mean maximal pupil constriction observed following light exposure from 6 to 12 mice ± SEM. Curves are fitted to a sigmoid function. Where error bars are not visible, they are obscured by the symbols. Asterisks show significant difference between Q175 HOM and WT mice, **P < 0.01. Hashes show significant differences between Q175 HOM and HET mice, #P < 0.05 and ##P < 0.01. There were no statistical differences between response of Q175 HET and WT mice.

