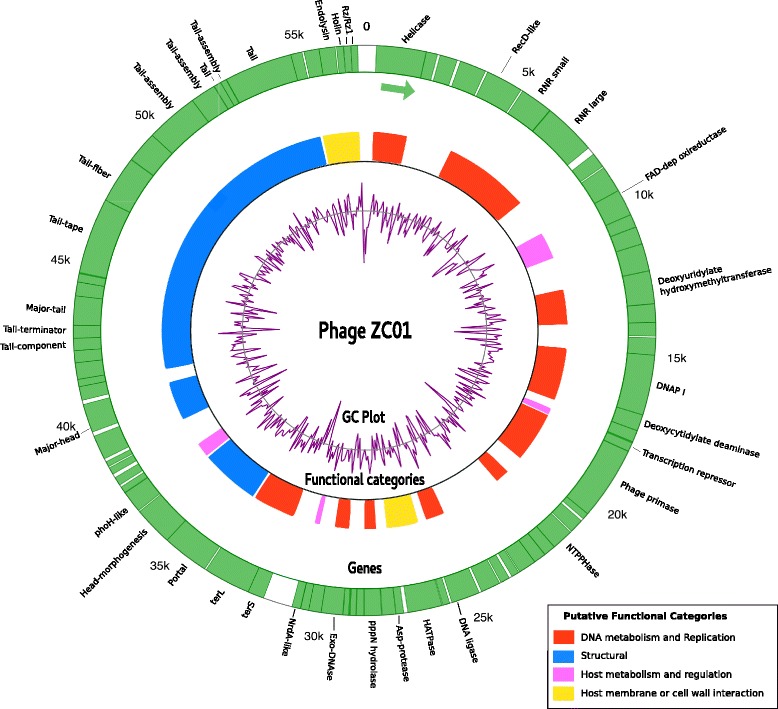
Fig. 1.

Phage ZC01 genome plot. Circular representation of the Pseudomonas phage ZC01 genome. The outer circle represents genes (all genes are on the plus strand, as indicated by the arrow). Putative functional categories were defined according to annotation and are represented by colors. Gaps in the functional block circle represent proteins with unknown function. The central graph (in purple) shows genomic GC content variation computed in 100 bp windows
