
Fig. 1.
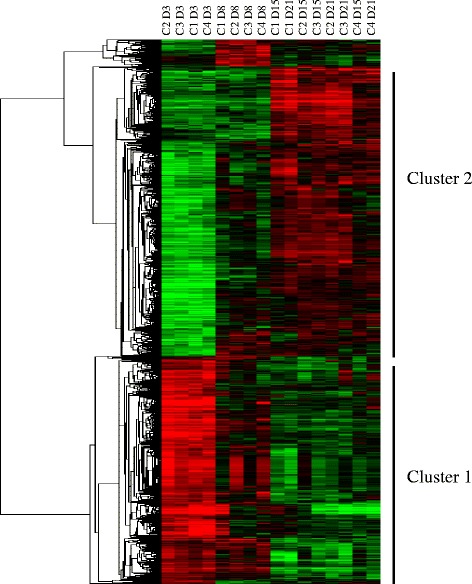
Heat map of the hierarchical clustering of genes differentially expressed (>3.0-fold, p < 0.02) among different days along rainbow trout adipocyte culture. The horizontal dendrogram represents the correlation distances between gene expression levels. Every column represents one independent culture (C) at one time-point (D3, D8, D15; D21; days 3, 8, 15, 21 respectively) meanwhile the different genes are represented by individual rows. The red color indicates high levels of expression while green represents low levels of expression. The intensity of both colors is related to the transcript expression level. Data are presented in the same format in Figures 2-8