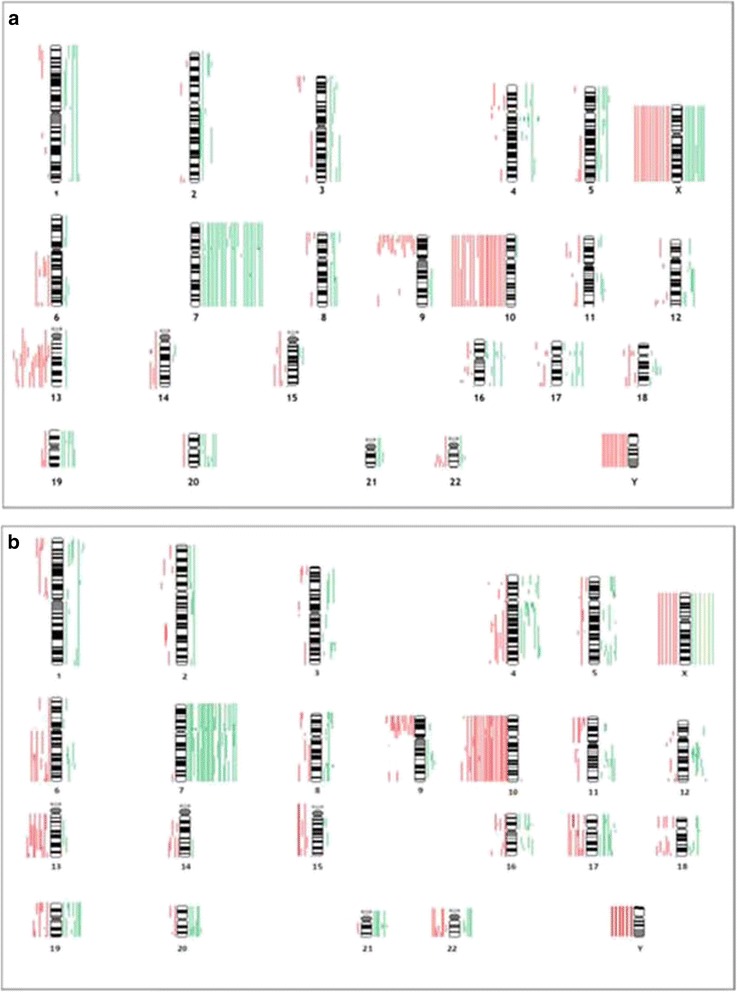
Fig. 5.

a Overview of genetic imbalances of the Carmustin-group. Lines on the left represent losses, and lines on the right represent gains; amplifications are in bold. b: Overview of genetic imbalances of the conventionally treated-group. Lines on the left represent losses, and lines on the right represent gains; amplifications are in bold
