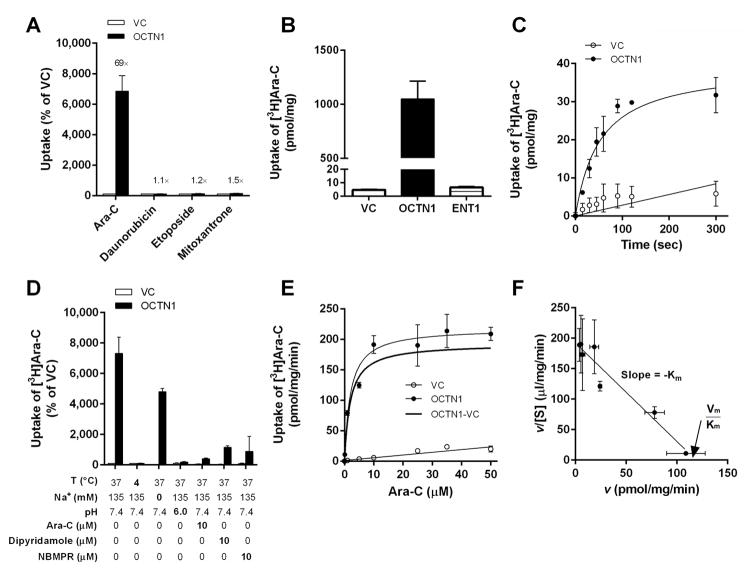
Fig. 2. In vitro transport of cytarabine by OCTN1.
Characterization of the transport of various AML-directed therapeutics (concentration, 1 μM; 5 min uptake) was performed in HEK293 cells transfected with an empty vector (VC) or OCTN1 (A). A comparison of OCTN1- and ENT1-mediated transport of cytarabine was done in HEK293 cells (B). Time-dependence of cytarabine (Ara-C) transport by OCTN1 at early time points (range, 10–300 s) (C). Sensitivity of OCTN1-mediated cytarabine transport to temperature, sodium, pH, and inhibitors (D). Concentration-dependent transport of cytarabine (1–50 μM; 5 min uptake) by OCTN1 (E), and these data shown as an Eadie-Hofstee transformation (F). Data are shown as mean values (symbols) and SEM (error bars), using 9–60 observations per group. Solid lines represent a fit of the experimental data to a non-linear maximum-effect model or linear regression. Abbreviations: v, transport velocity; [S], substrate concentration; Km, Michaelis-Menten constant; Vmax, maximal velocity.

