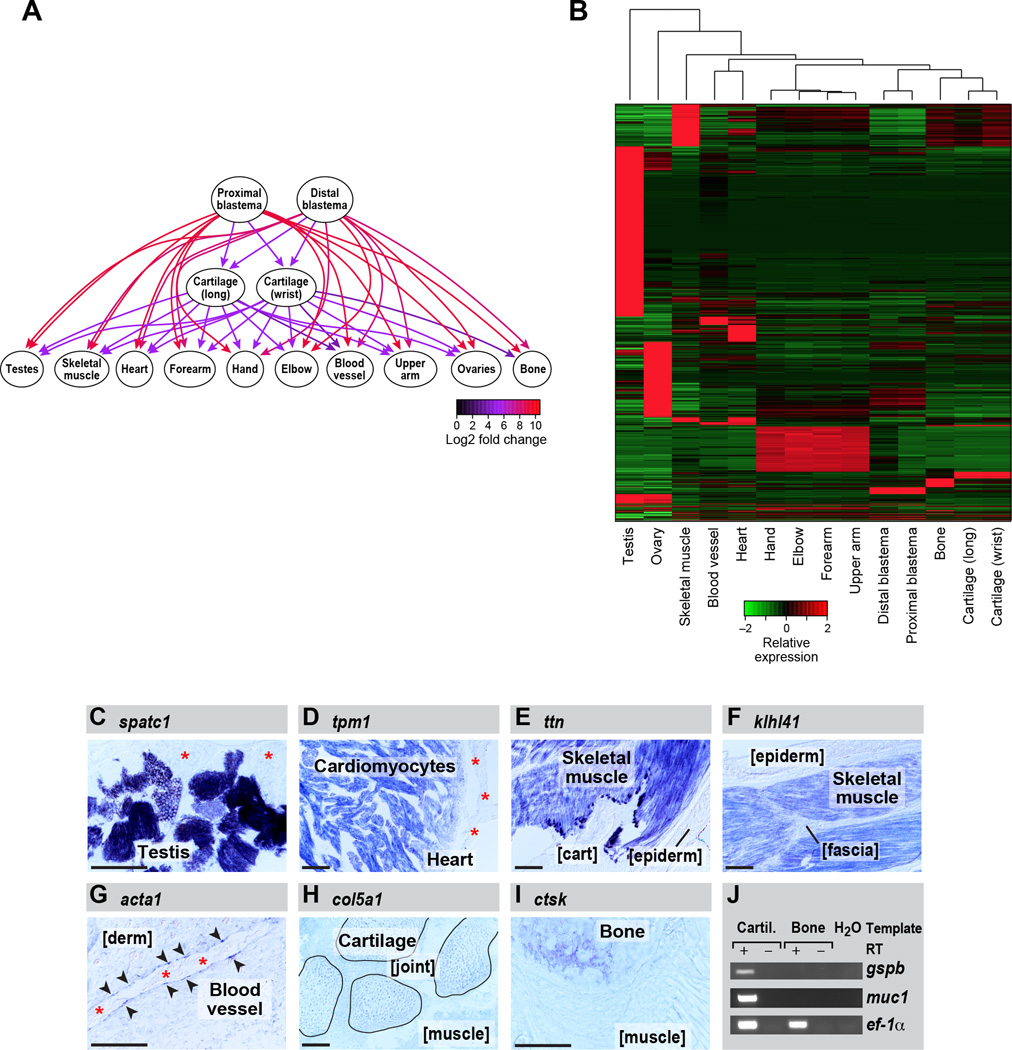
Figure 2. Differential gene expression analysis across each set of tissues identifies transcripts most enriched in specific tissue types.
(A) Graph illustrating the methodology for the identification of genes that are tissue-enriched in the context of all tissue pairwise comparisons using kazal-type serine peptidase inhibitor domain 1 (kazald1) as an example. Directed edges are drawn from upregulated to downregulated tissues, and fold changes in expression are indicated by the edge colors. (B) Heatmap showing all transcripts that are enriched in specific tissue types. (C–J) RNA in situ hybridization performed on tissue sections. (C) speriolin (speri) is enriched in the germ cells in testis but not detectable in adjacent support cells (asterisks). (D) tropomyosin 1 (tpm1) is enriched in cardiomyocytes within the heart and is not detectably expressed by other heart cell types such as epicardium (asterisks). (E) titin is enriched in limb skeletal muscle but is not detectable in adjacent cartilage (cart) and epidermis (epiderm). (F) kelch repeat and BTB domain-containing protein 10 (kbtba) is highly enriched in skeletal muscle and not detectable in adjacent tissues such as epidermis (epiderm) and fascia. (G) actin, alpha1, skeletal muscle (acts) mRNA is enriched in the very thin layer of vascular endothelial cells lining the blood vessels (arrowheads) and absent from adjacent dermis (derm). Asterisks mark red blood cell clumps in the vessel lumen. (H) collagen type V alpha 1 (co5a1) expression is highly enriched in cartilage; shown are four carpals (outlined) within the wrist. Expression in joint (between carpals) and in adjacent muscle is diminished. (I) A bone-enriched marker, cathepsin k (catk), is highly expressed in ossified portions of the humerus, and low in adjacent muscle. (J) platelet binding protein GspB (gspb) and mucin 1 (muc1) are detected in cartilage but not bone by RT-PCR. eukaryotic translation elongation factor 1 alpha 1 (ef-1a) serves as the loading control. Scale bars (bottom left of each panel) are 100µm. See also Figure S7, Table S2, Table S3, File S1 and File S2.

