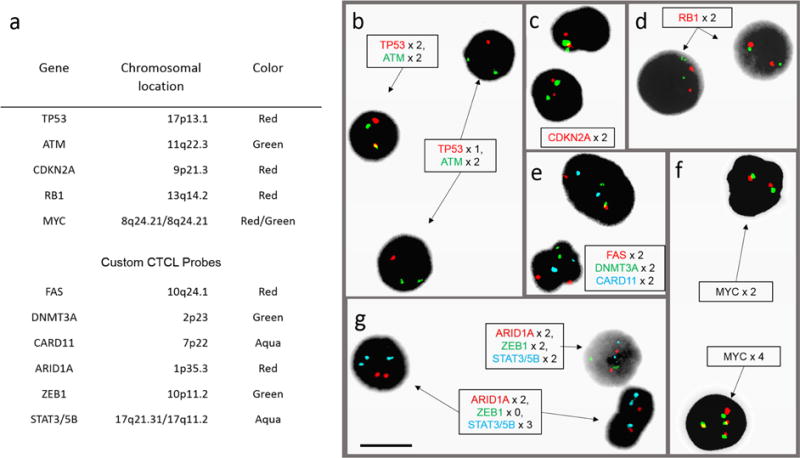
Figure 1. L-CTCL FISH panel composition and probe microscopy.

(a) Table of genes, chromosomal locations, and fluorescent colors for 11 clinically validated probes used in the CTCL FISH panel. (b–g) Post-hybridization microscopy images using 11-probe FISH panel on peripheral blood samples from patients with L-CTCL and abnormal FISH results. (b) Field with cell showing normal copy number of two TP53 (red) signals and two ATM (green) signals, and two cells with deletion of one copy of TP53. (c) Cells with two copies of CDKN2A (red) and 9q12 control probe (green). (d) Two cells with two copies of RB1 (red) and 13q control (green). (e) Signals for DMNT3A (green), CARD11 (aqua), and FAS (red), both cells showing two copies of each. (f) Cell on top with two copies of MYC stained with the red and green probes (both for MYC); cell below showing four copies of MYC. (g) Signals for ARID1A (red), ZEB1 (green), and STAT3/5B (aqua); one cell with normal copy numbers and two cells with homozygous deletion of ZEB1 and amplification of STAT3/5B. Black bar = 10 μm.
