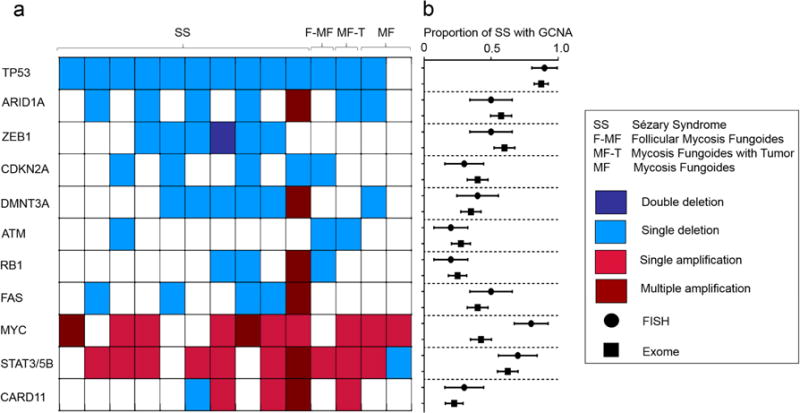
Figure 2. Distribution of deletions and amplifications detected by FISH.

(a) Heatmap of deletions and amplification in CTCL driver genes detected by the 11-probe CTCL FISH panel among 10 patients with SS, 1 patient with F-MF, 1 patient with MF-T, and 2 patients with MF. Each column shows FISH status for one patient. (b) Comparison of proportion (+/− standard error) of SS patients with abnormal copy numbers in each gene by FISH (n=10) versus CTCL exome sequencing (n=40) on non-overlapping patient cohorts. No significant differences were found for any gene (Fisher’s exact test, p > 0.1). *For STAT3/5B FISH probe, comparator gene from exome data is STAT5B.
