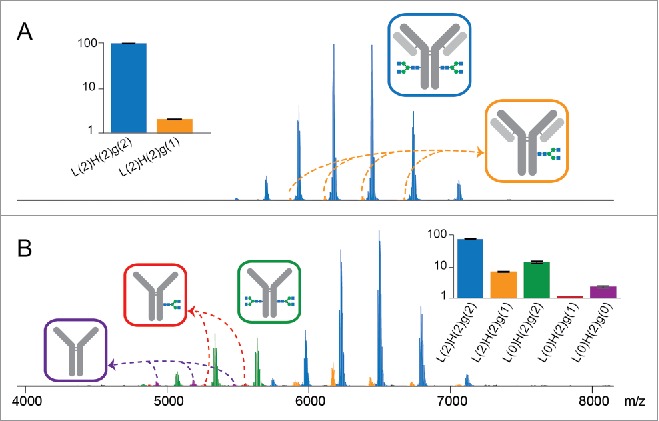
Figure 4.

mAb structural integrity probed by native MS at the intact protein level. (A) Native mass spectrum of trastuzumab, which populates predominantly the intact format L(2)H(2)g(2) (blue; L, H and g denote light chain, heavy chain and N-glycan chain, respectively, with numbers indicated in the parentheses) and marginally the single site-glycosylated format L(2)H(2)g(1) (orange). (B) For bevacizumab, in addition to the 2 formats detected in (A), the light-chain-free species with 2, 1 and 0 N-glycan chains attached (green, red and purple, respectively) are detected. Relative abundances of each species are estimated using summed ion intensities corresponding to all detected charge states, with data normalized to the ensemble of species and plotted on a logarithmic scale in the insets.
