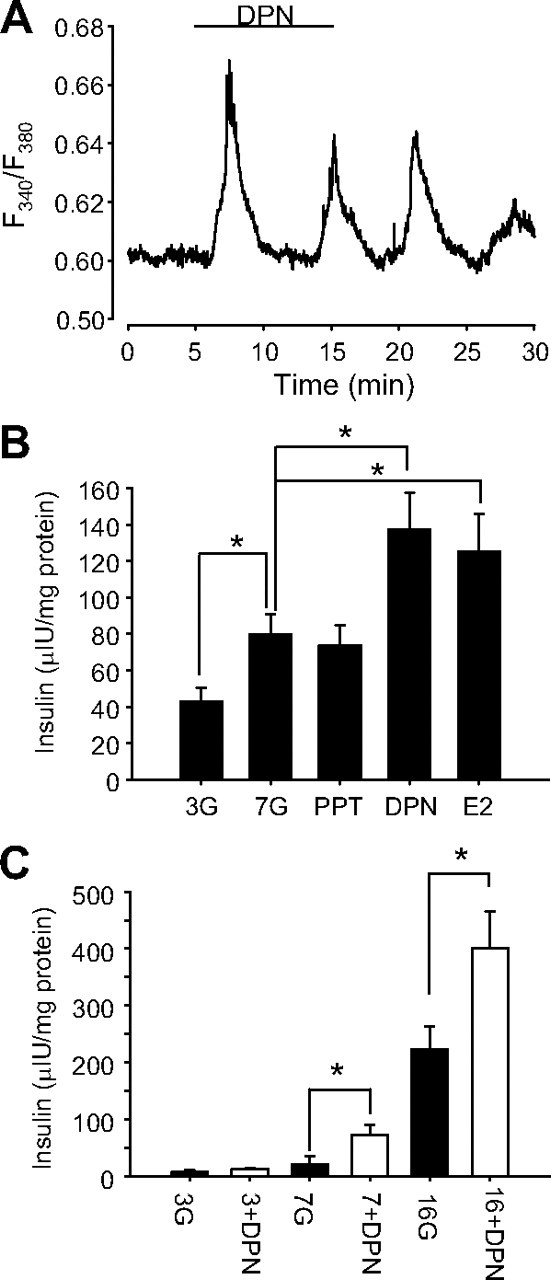
Fig. 3.

Activation of ERβ by DPN enhanced glucose-induced [Ca2+]i signals and insulin secretion. A, [Ca2+]i response of a typical islet of Langerhans in the presence of 7 mm glucose to 1 nm DPN applied for the period indicated by the bar. The Ca2+-dependent fluorescence of fura 2 is expressed as the ratio F340/F380 (see Materials and Methods). Note that [Ca2+]i oscillations are generated on a nonoscillatory plateau produced by 7 mm glucose. Representative of 11 islets. B, Glucose-induced insulin secretion from islets exposed to 3 mm glucose (3G), 7 mm glucose (7G), 7 mm glucose and 1 nm PPT (PPT), 7 mm glucose and 1 nm DPN (DPN), 7 mm glucose and 1 nm E2 (E2), or 1 nm E2 for 1 h (n = 10 mice). C, DPN-induced insulin secretion from islets exposed to 3 mm, 7 mm, and 16 mm glucose for 1 h (n = 6 mice). DPN was applied at 1 nm. Note that DPN action was significant only when stimulatory glucose concentrations were used. *, P < 0.05 Student’s t test. All stimuli have the same amount of vehicle 10−5% DMSO.
