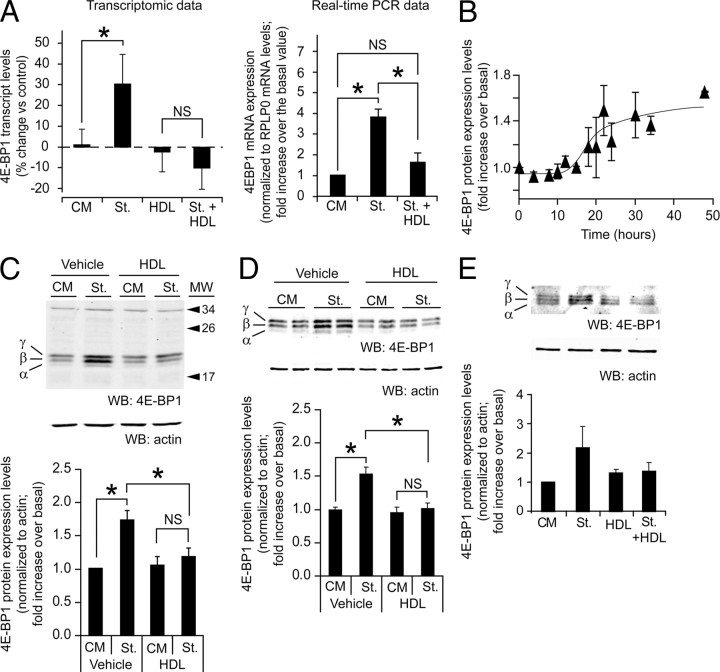
Fig. 3.
HDL regulation of 4E-BP1 levels. A, Left graph: 4E-BP1 transcript levels derived from the gene array data. The indicated fold changes were normalized to the mRNA levels obtained in control cells (mean ± sd). The results were derived from the cell samples used in Fig. 1A analyzed with two different 4E-BP1 probe sets. The threshold of significance was at P = 0.025 (two comparisons). Right graph: MIN6 cells were left untreated or subjected to a 6-h serum starvation in the presence or in the absence of 1 mm HDL. The 4E-BP1 mRNA levels were then quantitated by real-time PCR. The results are normalized to the mRNA expression levels of the reference protein RPLP0 and expressed as fold increase over the value obtained in untreated cells (mean ± sem; five independent experiments). The threshold of significance was at P = 0.0167 (three comparisons). B, 4E-BP1 total protein expression levels were followed during 48 h. βTC3 cells were grown for 2 d in complete medium, washed twice with PBS, and then incubated in culture medium lacking serum for the indicated periods of times. Cells were lysed and the lysates were subjected to Western blot analysis to assess 4E-BP1 protein expression levels. The results are expressed as the fold increase over the basal 4E-BP1 levels at t = 0 h (mean ± sem of six independent experiments). C, βTC3 cells were grown for 2 d in complete medium, washed twice with PBS, and then incubated for 24 h in serum containing medium (CM) or in medium lacking serum (St) in the presence or in the absence of 1 mm HDL. Cell lysates were subjected to Western blot analysis to assess 4E-BP1 and actin protein expression levels. Representative blots are shown at the top and the quantitation of the 4E-BP1 signals is shown at the bottom. The values for 4E-BP1 in the graph were normalized to actin levels (mean ± sem; eight independent experiments). The threshold of significance was at P = 0.0167 (three comparisons). MW, Molecular weight. D, MIN6 cells were treated as described in panel C. The results were derived from 19 independent experiments. The threshold of significance was at P = 0.0167 (three comparisons). E, Human islets were starved (St.) or not (CM) for 24 h in the absence or in the presence of 1 mm HDLs. The islets were then lysed and 10–20 μg of the lysates were subjected to Western blot analysis to assess 4E-BP1 expression. The values for 4E-BP1 in the graph were normalized to actin levels (mean ± sem; three independent experiments performed with islets from different donors). NS, Nonsignificant; WB, Western blot. *, Statistically significant as defined in Materials and Methods; α, hypophosphorylated form; β, intermediate phosphorylated form; γ, hyperphosphorylated form.

