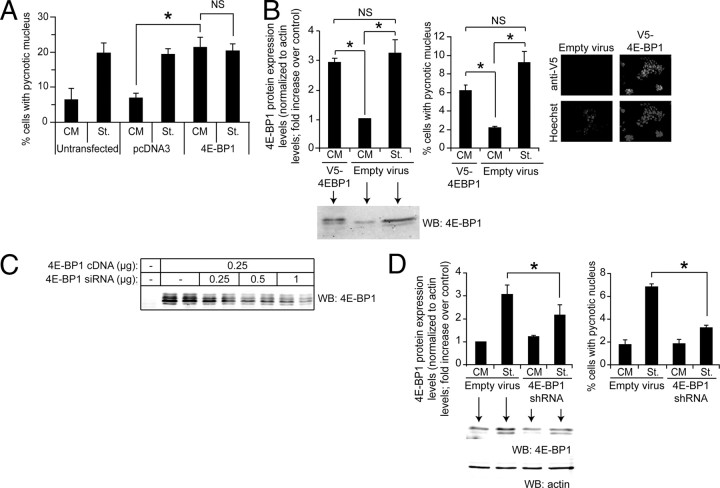
Fig. 5.
4E-BP1 induces apoptosis in insulin-producing cells. A, MIN6 cells were transfected with a control vector (pcDNA3) or with the m4E-BP1.sport6 plasmid encoding 4E-BP1 together with a GFP-encoding plasmid (pEGFP-C1). The following day, the cells were incubated in normal (CM) or serum-free medium (St.) for an additional 24-h period. Apoptosis was then determined by scoring GFP-positive cells displaying a pycnotic nucleus. The results correspond to the mean ± sem of five independent experiments. The threshold of significance was at P = 0.0167 (three comparisons). B, MIN6 cells were infected with 0.8 ml empty viruses or 0.8 ml V5–4E-BP1-encoding viruses. The culture medium was changed 24 h later. After an additional 48-h period, the cells were split and 2 d later the cells were incubated for 24 h in control serum-containing medium (CM) or in serum-free medium (St.). Finally, the cells were lysed to assess 4E-BP1 expression by Western blot analysis. Alternatively, the percentage of apoptotic cells was determined. The results correspond to the mean ± sem of four independent experiments. The threshold of significance was at P = 0.0167 (three comparisons). In addition, the cells were submitted to immunostaining using an anti-V5 antibody to assess the infection efficiency (the nuclei were labeled with the Hoechst 33342 dye). C, HEK 293T cells were transfected or not with a mouse 4E-BP1-encoding plasmid (m4EBP1.sport6) together with increasing quantities of 4E-BP1-specific shRNA-encoding plasmid (m4EBP1-29.spr). The cells were lysed 2 d later, and the lysates were subjected to Western blot analysis. The blot is representative of three independent experiments. Ectopic expression of 4E-BP1 resulted in the appearance of four to five immunoreactive bands on Western blots, a pattern that differed from what was observed with the endogenous protein (see Fig. 3D for example), and which may have resulted from overexpression of the protein from the m4EBP1.sport6 plasmid. Note that the exposure time used to reveal the ectopically expressed 4E-BP1 barely allows the visualization of the endogenous protein (first lane). D, MIN6 cells were infected with m4E-BP1-si29 lentiviruses. The cells were washed 72 h later twice with PBS and starved or not for an additional 24-h period, at which point the cells were lysed to assess 4E-BP1 expression (left panel). Alternatively, apoptosis was scored (right panel). The results correspond to the mean ± sem of four independent experiments. The threshold of significance was at P = 0.0167 (three comparisons). The differences in basal and starvation-induced apoptosis between panel A and panels B and D likely result from the use of different transduction methods (transfection in panel A and infection followed by cell recovery in panels B and D). Despite these differences, the fold increase induced by starvation over the basal apoptosis remains similar (∼3 fold). NS, Nonsignificant; WB, Western blot. *, Statistically significant as defined in Materials and Methods; α, hypophosphorylated form; β, intermediate phosphorylated form; γ, hyperphosphorylated form.

