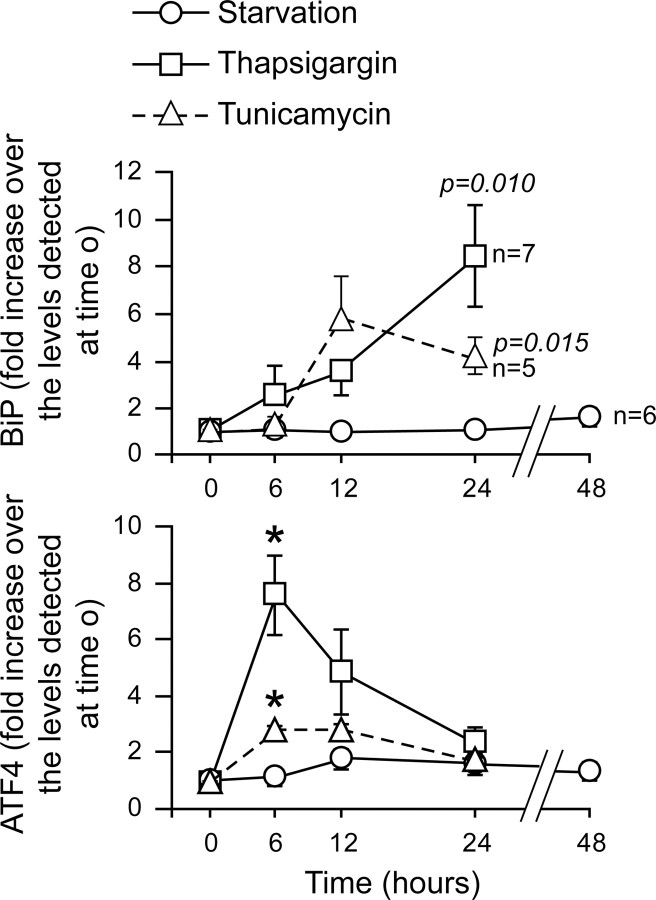
Fig. 7.
ER stress markers are not up-regulated upon serum deprivation in MIN6 cells. MIN6 cells were stimulated with 0.5 μm TG, 2 μg/ml TM, or were serum deprived for the indicated periods of time. The cells were then lysed and the lysates were subjected to Western blot analysis using an antibody specific for the ER stress marker BiP. Alternatively, the RNA was isolated from the cell extracts, reverse transcribed into cDNA, and amplified by real-time PCR using primers specific for the ER stress marker ATF4. The graph represents the quantitation of the Western blot signals or the real-time PCR data, normalized to the values at time 0 h. The results correspond to the mean ± sem of the indicated number of independent experiments (when not indicated, the number of independent experiments corresponds to five). The threshold of significance was at P = 0.005 (10 comparisons). For the BiP quantitation, the P values <0.05 are indicated. *, Statistically significant as defined in Material and Methods.

