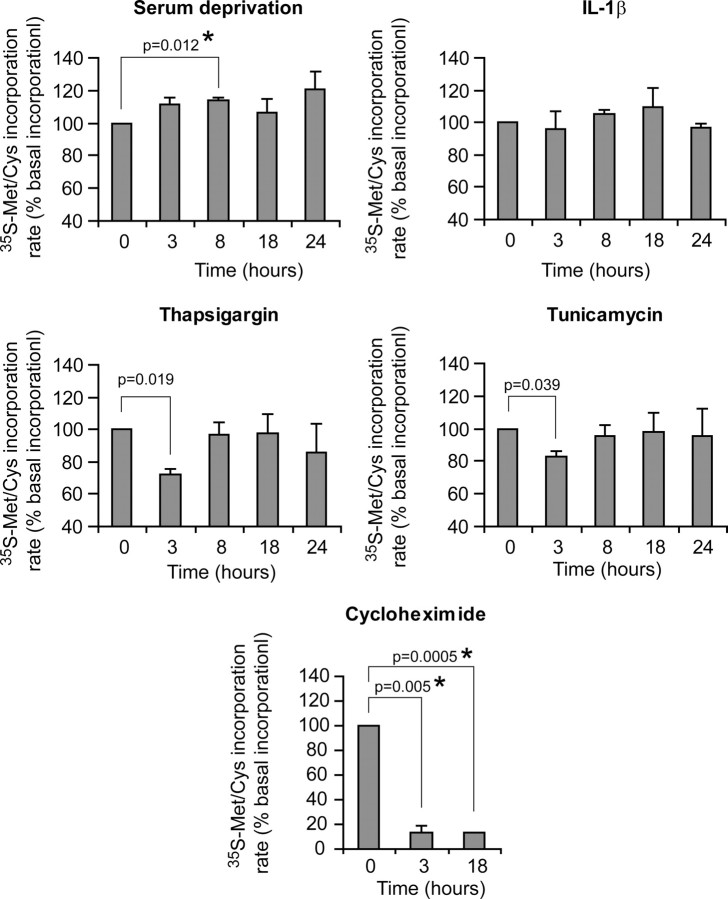
Fig. 8.
Amino acid incorporation upon treatments that modulate 4E-BP1. MIN6 cells were serum starved or treated with 0.5 μm thapsigargin, 2 μg/ml tunicamycin, 10 ng/ml IL-1β, or 20 ng/ml cycloheximide for the indicated periods of time. The cells were then pulsed with [35S]methionine/cysteine for 15 min, and the incorporation of the radioactive amino acid into proteins was determined as described in Materials and Methods. The results shown are normalized to the values obtained at t = 0. The graph represents the mean ± sem of three independent experiments. Differences with the values at t = 0 were assessed using a t test. The P values that are <0.05 are indicated, and asterisks indicate significance after Bonferonni correction. The threshold of significance was at P = 0.0125 (four comparisons) and P = 0.025 (two comparisons) for the first four graphs and the last graph, respectively. NS, Nonsignificant.

