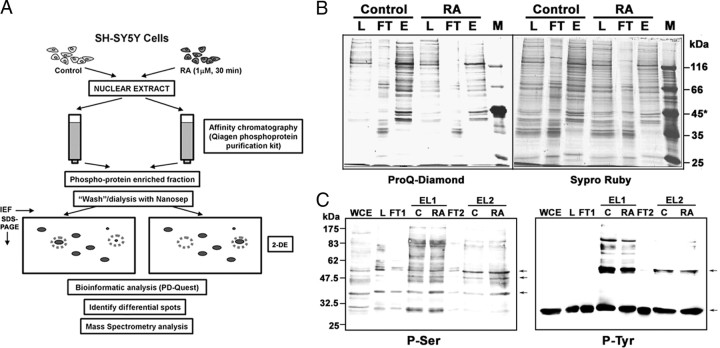
Fig. 2.
Proteomic approach to the identification of RA-induced phosphorylation changes in nuclear proteins. A, General strategy. Neuroblastoma cells were treated with RA or vehicle for 30 min, and nuclear protein extracts were prepared. Phosphoprotein-enriched fractions were obtained by affinity chromatography, dialyzed with Nanosep spin columns, and loaded onto 2DE-gels (Isoelectrofocusing/SDS-PAGE). After electrophoresis, the gels were stained with CBB and compared with the help of a conventional bioinformatic package (Bio-Rad PD-Quest), and the differential spots were detected. The individual spots were isolated and digested with trypsin, and the proteins were identified by MS (peptide sequencing by CID-MS/MS and/or MALDI-TOF/TOF peptide fingerprinting). B, Enrichment in phosphoproteins shown by phosphoprotein-specific staining. The different fractions from the purification columns were run on SDS-PAGE gels, and the phosphoproteins were stained with ProQ-Diamond dye (left). After documentation, the gel was destained and total proteins were stained with SyproRuby (right). Total nuclear lysate (load, L), flow-through (FT), and phosphoprotein eluate (E) from control and RA-treated cells are shown (4 μg protein per lane). *, Molecular mass markers included ovalbumin (45 kDa, two phosphorylated residues). C, Enrichment in phosphoproteins shown by immunodetection of phosphorylated amino acid residues. The different fractions from the purification columns were run on SDS-PAGE gels, transferred to nitrocellulose, and incubated sequentially with specific antibodies against phosphoserine and phosphotyrosine. Whole-cell extract (WCE), nuclear lysate (load, L), flow-through (FT1), and phosphoprotein eluate [EL1, from Control (C) and RA-treated cells (RA)]. In this experiment the flow-through fractions from the affinity purification were loaded to a second phosphoprotein purification column and the flow-through fraction (FT2) and eluates [EL2, from Control (C), and RA-treated cells (RA) from this second column are shown]. Each lane contains 25 μg protein. For simplification only the WCE, L, FT1, and FT2 fractions from control cells are shown. The arrows point to protein bands that are present in the eluates from the second phosphoprotein purification column (lanes labeled “EL2”).

