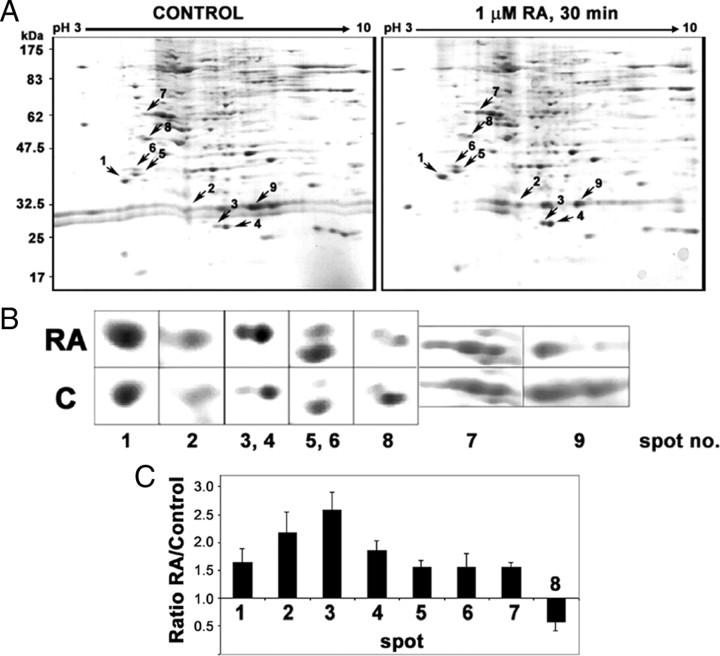
Fig. 3.
Comparison of nuclear phosphoprotein patterns from control and RA-treated cells by 2DE. A, RA-induced changes in the patterns of nuclear phosphorylated proteins. Representative 2DE gel pair with nuclear phosphorylated protein samples from untreated (control) or RA-treated cells (1 μm, 30 min). Each gel was loaded with 125 μg nuclear phosphorylated protein. Isoelectrofocusing (pH 3–10) was run as first dimension and SDS-PAGE (12.5%) was run as second dimension. The gels were stained with CBB. Arrows mark the selected spots that appeared increased (1–7), decreased (8), or displaced toward lower pH (9) as a consequence of the RA treatment. B, Zoom-in detail of the regions including the selected differentially expressed spots. C, Quantitative analysis of the differentially expressed spots. Optical density was measured in five matched gel pairs from control and RA-treated nuclear proteins for the selected spots (1–8). After normalization for the total protein density, the mean and sd values were calculated for each of the spots and represented as relative value (ratio RA/control).

