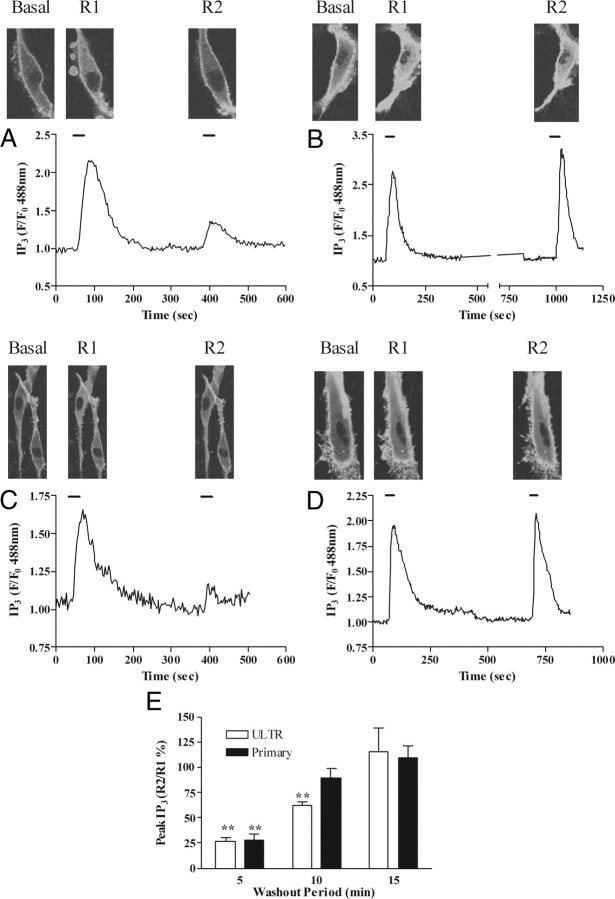
Fig. 2.
Desensitization and resensitization of OTR-stimulated PLC signaling in ULTR and primary myometrial cells. Cells expressing eGFP-PH were challenged with oxytocin (100 nm, 30 sec) before (R1) and after (R2) a variable wash period. Representative images and traces showing the extent of OTR desensitization 5 min (A and C), 15 min (B), and 10 min (D) after initial oxytocin challenge in ULTR (A and B) and primary myometrial (C and D) cells. F/F0, Fluorescence divided by fluorescence at time zero. OTR desensitization was determined as the relative change in R2 response compared with R1. Cumulative data (E) are expressed as means ± sem for the % change in R2 relative to R1; n = 8–14 cells for each time-point, from at least eight separate experiments. Primary cells experiments were from at least three separate patient donors; **, P < 0.01; R2:R1 ratios for 5 min and 10 min vs. 15 min delay after R1.

