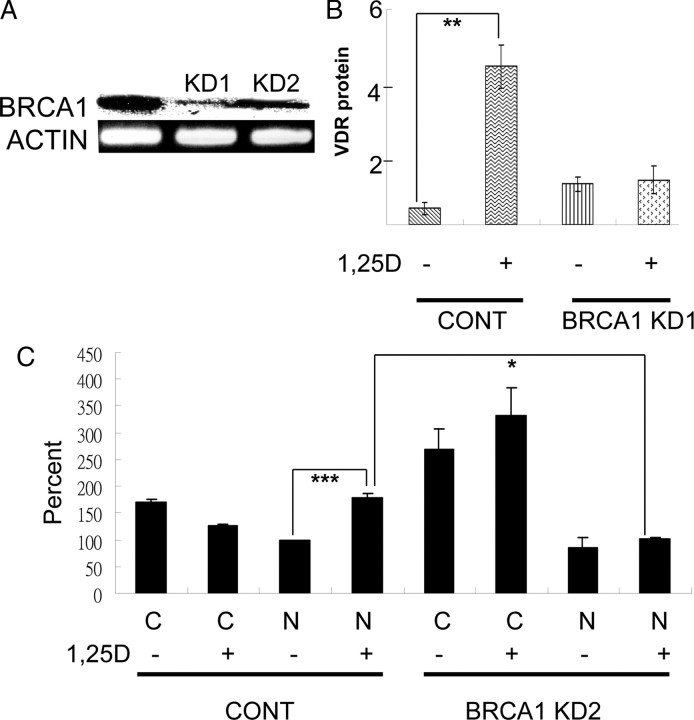
Fig. 8.
Effect of knockdown of BRCA1. Ros 17/2.8 cells were transfected with either a control plasmid or a plasmid expressing ShRNA for BRCA1 and then selected for puromycin resistance. Panel A shows the result of RT-PCR for BRCA1 in two cell lines produced (KD1 and KD2). The image for the BRCA1 amplicon is reversed so that it is possible to see the band in KD1. Both lines were cultured and incubated in the absence of FBS as before and then treated with 1α,25(OH)2D3 for 8 h (panel B, which shows KD1) or 30 min (panel C, which shows KD2). Separate nuclear and cytoplasmic extracts were made from the KD2 cells. Panels B and C show quantification of Western blots (n = 4). For panel C, the results were normalized to the value for the nuclear fraction in the control cells in the absence of 1,25D to be able to combine analyses. This value was set at 100%. Quantification also allowed for the relative proportions of the nuclear and cytoplasmic extracts applied to the gel and was normalized to β-actin. N, Nucleus; C, cytoplasm; CONT, control; 1,25D, 1α,25(OH)2D3. *, P < 0.03; **, P < 0.01; ***, P < 0.001.

