Fig. 3.
CART-Induced Erk1/2 Activation
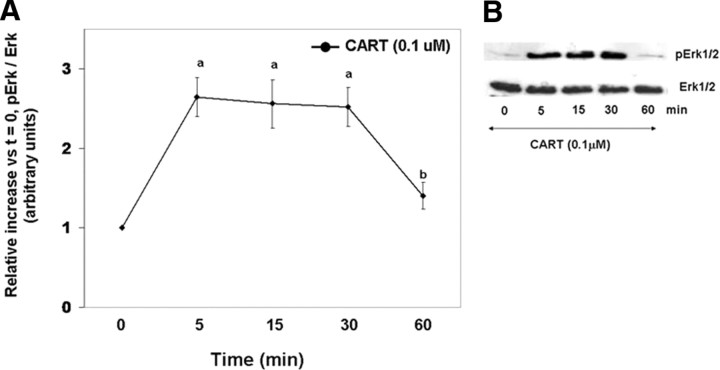
Time course of the relative increase in Erk1/2 activation (pErk/total Erk) vs. time zero observed for bovine GCs collected after stimulation with 0.1 μm CART (A). Representative Western blots demonstrating the pattern of Erk1/2 activation in GCs stimulated with CART (B). The data depicted in panel A are represented as the mean ± sem from three replicate experiments, and different superscripts denote significant differences in Erk1/2 activation between time points (P < 0.05).

