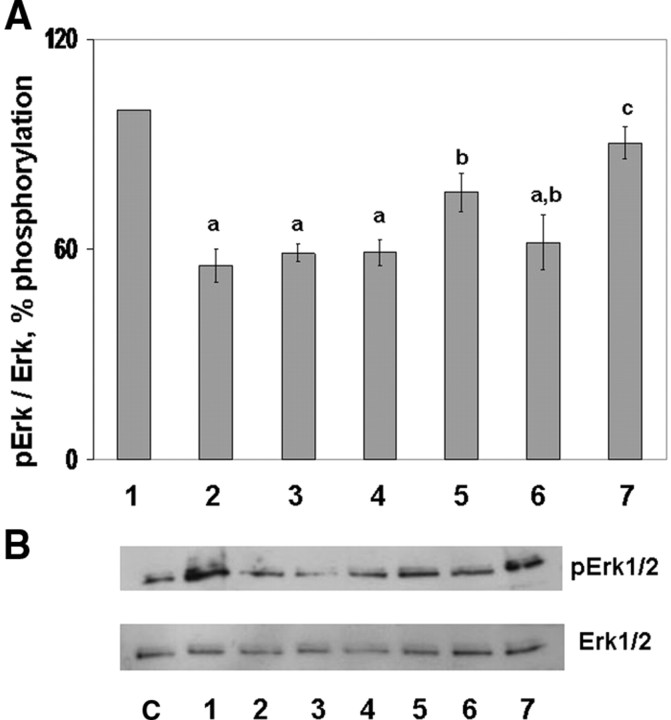
Fig. 5.
CART-Induced Phosphatase Activity
Decrease in percentage of Erk1/2 phosphorylation (phosphatase activity) observed after coincubation of 100 μg protein collected from bovine GCs containing high levels of phosphorylated Erk1/2 (activated Erk standard pool; GCs treated with 25 ng/ml FSH for 30 min; lane 1) with 100 μg of protein from lysates of GCs stimulated with FSH (25 ng/ml) + CART (0.1 μm) for 30 (lane 2) and 120 min (lane 3), CART (0.1 μm) for 60 min (lane 4), FSH (25 ng/ml) for 60 (lane 5) and 120 min (lane 6) and from GCs preincubated for 120 min with phosphatase inhibitors [sodium orthovanadate (1 mm); a tyrosine phosphatase inhibitor and OA (50 nm); a serine/threonine phosphatase inhibitor] and then stimulated with FSH + CART for 120 min (lane 7) (A). Representative Western blots demonstrating decrease in phosphorylated Erk1/2/total Erk1/2 induced by coincubation of activated Erk lysate (standard pool) with the above-mentioned samples (lanes 1–7 denoted in panel A, source of phosphatase activity being quantified). Lysates of GCs treated with media alone were also used as a control (lane C) (B). The data depicted in panel A are represented as the mean ± sem from three replicate experiments, and different superscripts denote significant differences between treatments (P < 0.05).

