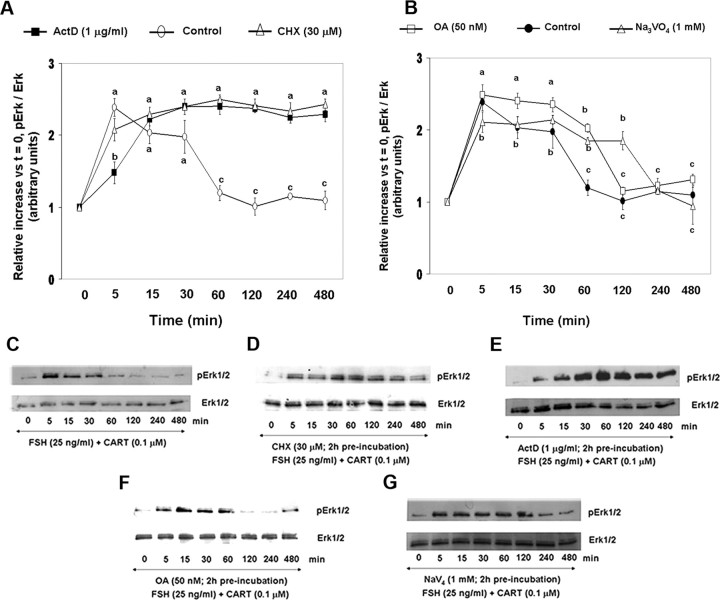
Fig. 6.
Effect of Transcription, Translation, and Serine/Threonine and Tyrosine Phosphatase Inhibitors on CART-Induced Phosphatase Activity
Relative increase in Erk1/2 activation (pErk/total Erk) vs. time zero observed after preincubation of bovine GCs in media alone, CHX (30 μm), and ActD (1 μg/ml) for 120 min followed by FSH (25 ng/ml) + CART (0.1 μm) stimulation (A). Relative increase in Erk1/2 activation vs. time zero after preincubation of GCs in media alone, OA (50 nm) and Na3VO4 (1 mm) for 120 min followed by FSH + CART stimulation (B). Representative Western blots demonstrating the pattern of Erk1/2 activation in GCs preincubated with media alone (C), CHX (D), ActD (E), OA (F), or Na3VO4 (G) for 120 min followed by FSH + CART stimulation. The data depicted in panels A and B are represented as the mean ± sem from three replicate experiments, and different superscripts denote significant differences across and within treatments and time points (P < 0.05).

