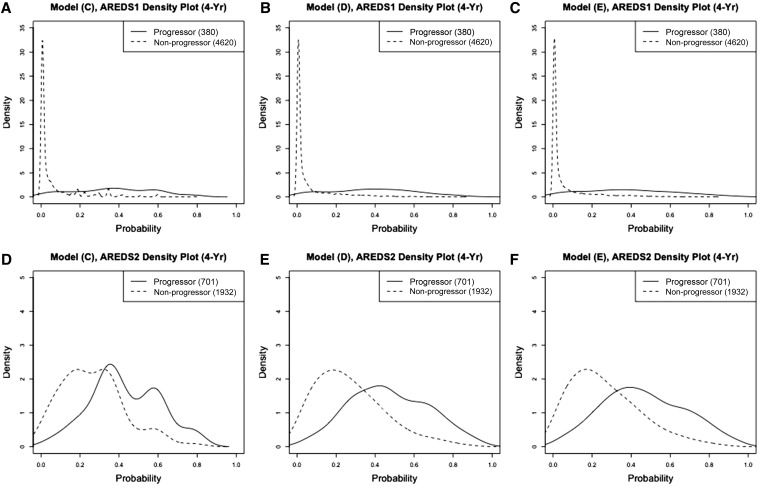
Figure 4.
Density curves of the predicted progression risks for progressors and nonprogressors from full data. (A–C) prediction model C, model D, and model E evaluated on 4-year progression risk in AREDS, respectively; (D–F) prediction model C, model D, and model E evaluated on 4-year progression risk in AREDS2, respectively.

