Figure 5.
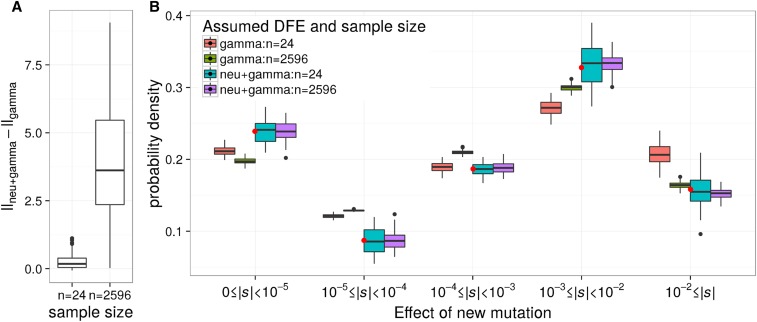
Small sample size and misspecification of the DFE can explain some of the differences between previous estimates and our estimates. Gamma and neutral+gamma DFEs were fit to 100 simulated data sets of sample sizes n = 24 and n = 2596 chromosomes, where the true DFE was neutral+gamma distributed (pneu = 0.164, α = 0.338, β = 358.8). (A) The distributions of the difference in log-likelihood between the gamma and neutral+gamma distributions. When the sample size is large (n = 2596) the neutral+gamma distribution has a higher log-likelihood than the gamma distribution. However, the small samples (n = 24) are unable to distinguish between the gamma and neutral+gamma distributions. (B) The estimated proportions of new mutations having different selective effects when fitting the gamma and neutral+gamma distributions. Note that when n = 24, the gamma distribution overpredicts the proportion of strongly deleterious mutations (|s| ≥ 0.01). Red dots denote the true proportion of mutations in each bin. The boxes cover the first and third quartiles, and the band represents the median. The whiskers cover the highest and lowest datum within 1.5 times the interquartile range from the first and third quartiles. Lastly, any data outside that region are plotted as outlier points.

