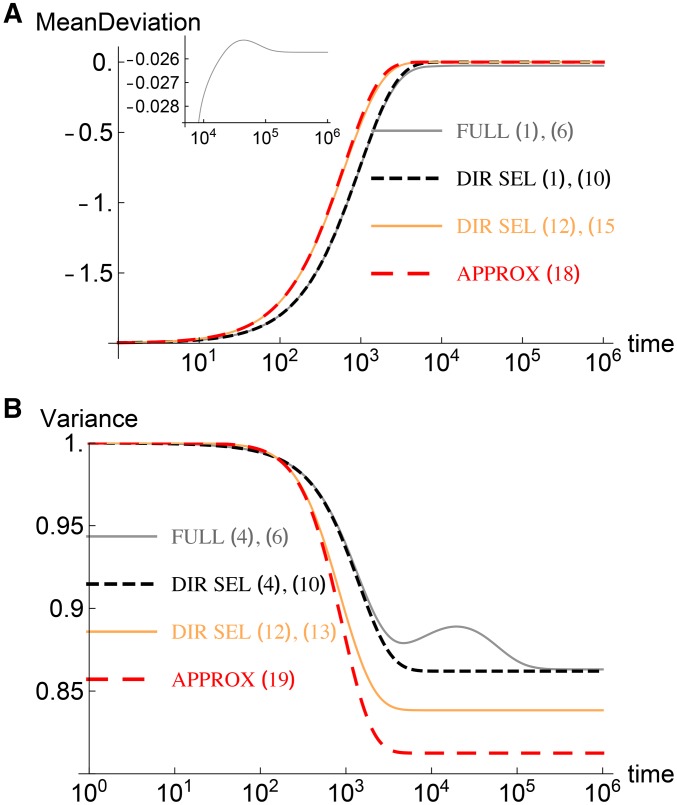
Figure 1.
Most effects are small: Dynamics of the (A) mean deviation and (B) variance (relative to its initial value) for and The other parameters are The inset in (A) shows the mean deviation in the full model at large times. The gray and black curves are obtained for a single realization of effects in which 197 out of loci have effects smaller than the mean. The orange and red curves, on the other hand, are averaged over the distribution of effects. The results from the two procedures match when the number of loci is very large as explained in Discussion.

