Figure 3.
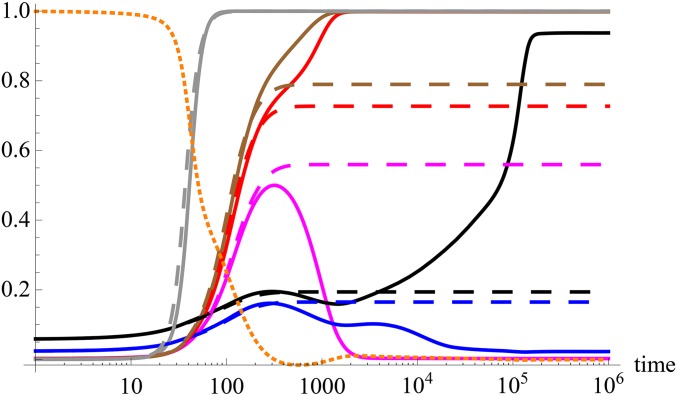
Selective sweeps when most effects are large: Dynamics of the scaled absolute mean deviation (dotted, orange) and allele frequency (solid and dashed curves) for some loci that satisfy the necessary condition where and The numerical solution of the full model (6) (solid) and directional selection model (10) (dashed) are shown for the effect size (gray), 0.340 (brown), 0.319 (red), 0.272 (magenta), 0.092 (blue), and 0.060 (black). The other parameters are Except for the locus with effect the allele frequency for the directional selection model exceeds one half at loci whose allele frequency for the full model sweeps. The allele frequency for the locus with effect also increases nearly to fixation, but at very long times where the directional selection model is not valid. Because this frequency increase is relatively slow, a genomic signature similar to a selective sweep cannot be expected.

