Figure 4.
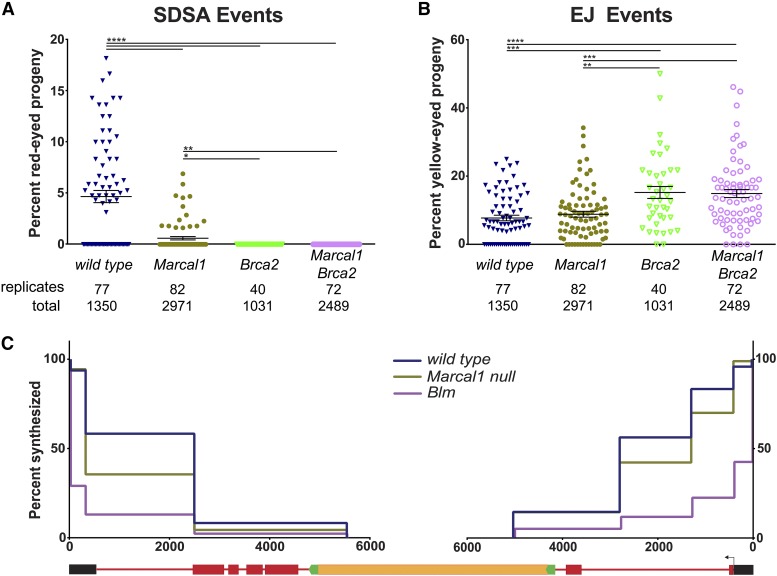
Marcal1 mutants have reduced SDSA capacity in the P{wa} assay. (A) SDSA events are measured as the percentage of scored progeny with red eyes. Mean and SEM are indicated. Marcal1 null mutant, Brca2 mutant, and Marcal1 Brca2 double mutant frequencies were all significantly reduced compared to wild type. The numbers of single males (biological replicates) and total progeny scored are listed below the graph. (B) EJ events were measured as the percentage of scored progeny with yellow eyes. Brca2 and Marcal1 Brca2 mutants had significantly elevated EJ compared to wild type and Marcal1 single mutants. P-values: **** P < 0.0001, ** P < 0.002, * P < 0.05, based on parametric ANOVA. (C) Synthesis tracts in repair events recovered in yellow-eyed progeny were measured using a series of PCRs. Each interval was measured independently and quantified as a percentage of total independent events analyzed. x-axis denotes distance (in nucleotides) from each end of the gap, on the same scale as the schematic of P{wa} below. y-axis is percent of events analyzed that had a positive PCR and therefore synthesized at least as far as the most internal primer. Marcal1 (n = 90) was not significantly different from wild type (n = 48) when corrected for multiple intervals (Materials and Methods). Blm (n = 75) mutants were significantly different (P < 0.0001) from both wild type and Marcal1.

