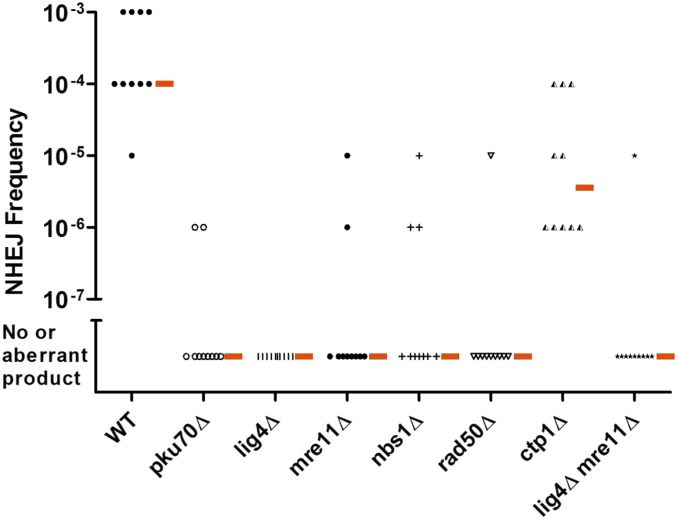
Figure 5.
Hermes excision frequencies of different NHEJ mutants. Each data point represents the excision frequency of a single colony from the WT or mutant cells analyzed by PCR (Figure 4). The short red bars indicate the median excision frequency for the strain, which is obtained by ranking the frequencies from highest to lowest and averaging the fifth and sixth values. The differences between the WT and all strains were statistically significant (P < 0.001 for all strains by Mann–Whitney two-tailed rank sum test except for WT vs. ctp1∆, which was P = 0.0021). NHEJ, nonhomologous end-joining; wild-type, WT.

