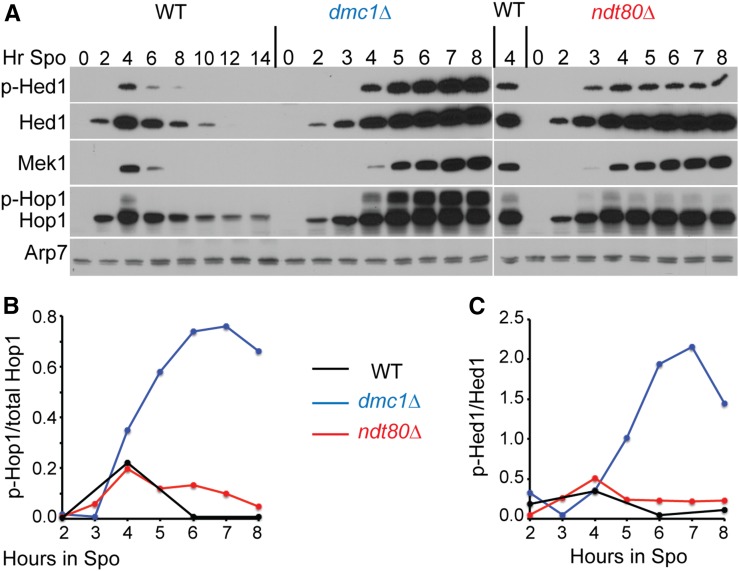
Figure 6.
Mek1 kinase activity correlates with the amount of phosphorylated Hop1. (A) WT (NH716), dmc1∆ (NH792), and ndt80∆ (NH2188) diploids were transferred to Spo medium and assayed at different time points for the presence of Hed1, Hed1 phospho-T40 (p-Hed1), Hop1, Mek1, and Arp7. (B) Fraction of phosphorylated Hop1 as a function of time. The Hop1 and p-Hop1 bands from the same lanes were quantified and normalized to Arp7. The ratio of p-Hop1/(p-Hop1 + Hop1) was plotted. (C) Fraction of p-Hed1 as a function of time. Hed1 and p-Hed1 were normalized using Arp7 from the same lane for each timepoint and the p-Hed1/Hed1 ratio was plotted. This experiment was repeated twice with similar results. Spo, sporulating culture; WT, wild type.

