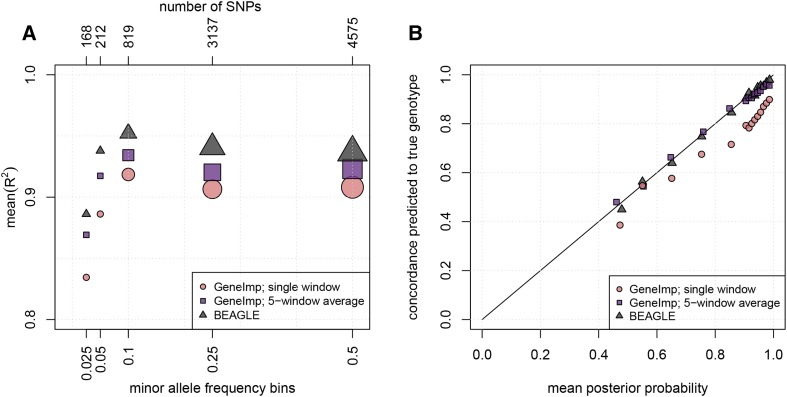
Figure 2.
Comparison of GeneImp with BEAGLE. (A) Imputation mean- as a function of MAF. Each point is computed by averaging the values for SNPs within a MAF bin. The size of the marker reflects the number of SNPs in the MAF-bin. BEAGLE has the highest mean- followed closely by GeneImp-5-window-average. (B) Calibration of genotype posterior probabilities. Imputed genotypes are split into bins according to their posterior probability distribution. We plot the mean posterior probability in each bin (x-axis) against the percentage of correctly predicted genotypes in each bin (y-axis). BEAGLE and GeneImp-5-window-average are well-calibrated, while GeneImp-single-window is overconfident.

