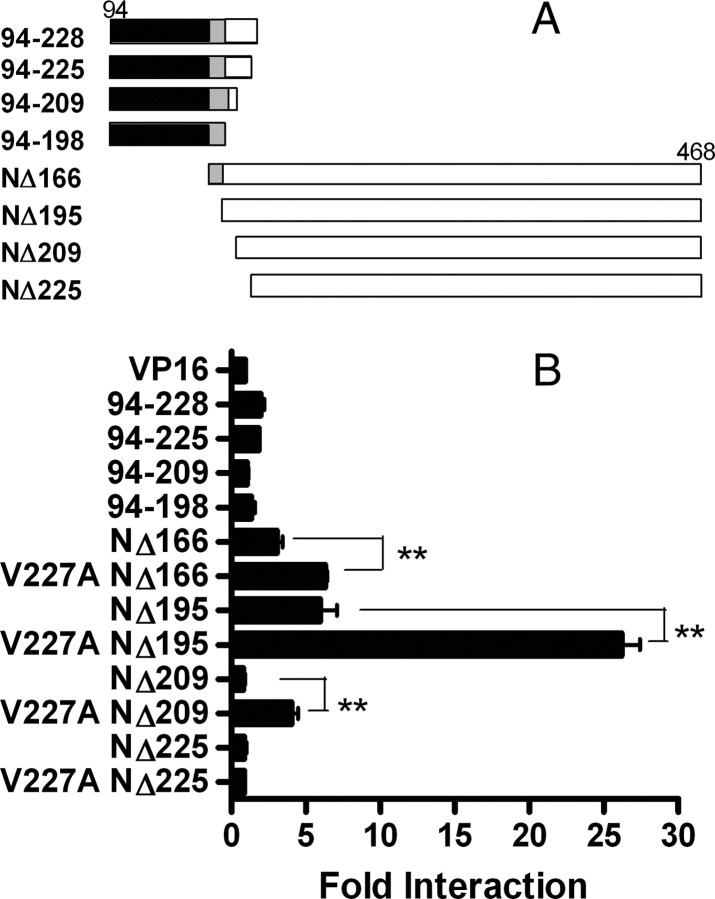
Fig. 6.
Interactions of NCoR with Deletion Fragments of PPARα Hinge
A, Schematic diagram of VP16-PPARα truncation fragments. Black boxes represent DBD (residues 94–166); gray boxes represent residues 167–195 before helix 1. White boxes represent residues 196–468 of helix 1 to helix 12. B, WT or V227A PPARα VP16 truncated fragments (100 ng) were coexpressed with G3 (NΔ2250) (Fig. 6) (100 ng) and the (UASG)5-Luc reporter gene (500 ng) in the mammalian two-hybrid assay. Fold interaction (mean ± sd of three replicates) was expressed as fold of VP16 empty vector. *, P < 0.05; **, P < 0.01.

