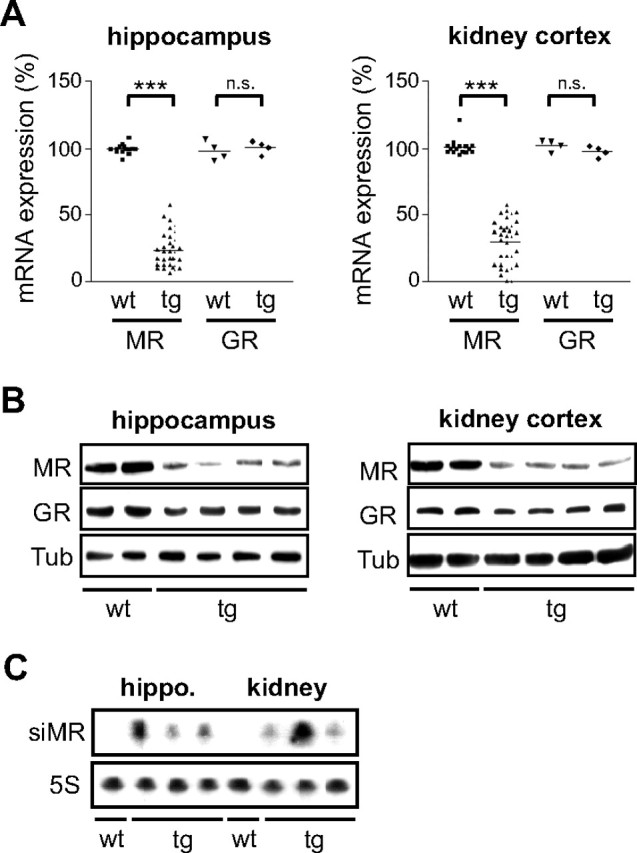
Fig. 2.

Silencing of the MR in Transgenic Rats
A, Analysis of GR and MR mRNA levels in kidney and hippocampus of 3-wk-old wild-type and transgenic rats by quantitative PCR. Each symbol represents one individual animal. Values are normalized to β-actin expression. The average expression in wild-type animals was set to 100%. Statistical analysis was performed by Student’s t test. ***, P < 0.001; n.s., not significant (n.s., P > 0.05). B, Analysis of GR and MR levels by Western blot using protein lysates of some of the animals depicted in panel A (20 μg per lane). β-Tubulin (Tub) served as loading control. C, Analysis of MR-specific siRNA expression in hippocampus and kidney of four selected animals from panel A by Northern blot. Expression of the 5S rRNA served as control. tg, Transgenic; wt, wild type.
