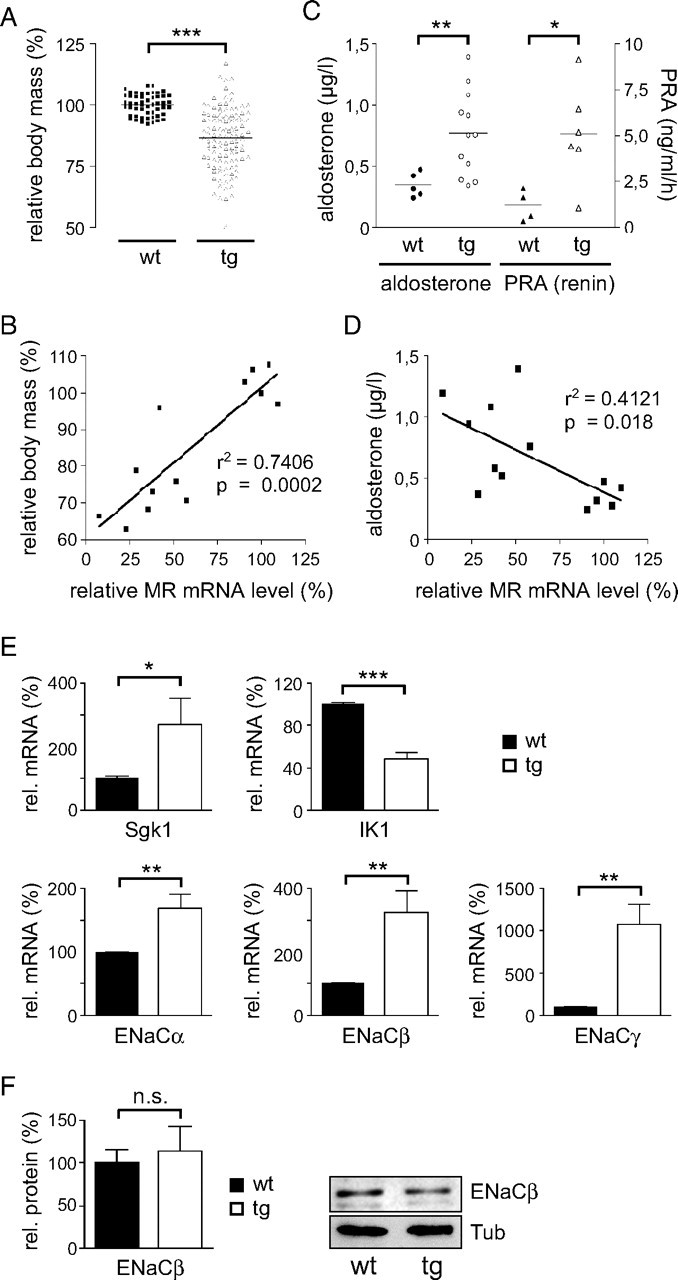
Fig. 3.

Pathophysiology of Young siMR Transgenic Rats
A, Relative body mass of the siMR transgenic rats at 3 wk of age compared with wild-type controls. The average weight of the wt rats was set to 100%. B, Correlation of the reduced relative body mass with the diminished relative MR mRNA expression. C, Analysis of serum aldosterone levels (left y-axis) and plasma renin activity (PRA, right y-axis) in 3-wk-old wild-type and transgenic rats by RIA. D, Inverse correlation of the increased serum aldosterone levels with the diminished relative MR mRNA expression. Each symbol in panels A–D represents one individual animal. E, Expression analysis of five bona fide MR target genes in the kidney of 3-wk-old wild-type and transgenic rats by quantitative PCR. Values are normalized to β-actin expression. The average expression in wild-type animals was set to 100% (n = 4–6 for wild type and n = 8–18 for transgenic). F, Analysis of ENaCβ protein levels in the kidney of wild-type and transgenic rats by Western blot (20 μg per lane). Values are normalized to β-Tubulin (Tub). The relative amount of ENaCβ protein was quantified by densitometry (left panel, n = 4). A representative Western blot analysis is depicted in the right panel. Statistical analysis in all panels was performed by Student’s t test or linear regression. *, P < 0.05; **, P < 0.01; ***, P < 0.001; n.s., not significant (n.s., P > 0.05). r2, Correlation coefficient; Tg, transgenic; wt, wild type.
