
Fig. 2.
TR Mediates the T3-Induced Phosphorylation of AMPK
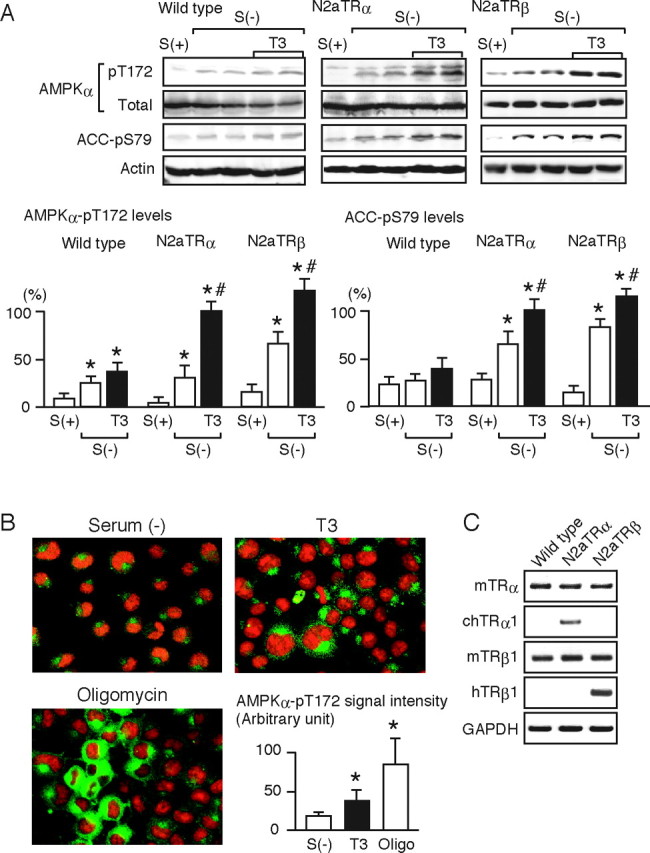
A, Wild-type N2a cells and N2aTRα and N2aTRβ cells were cultured with [S(+)] or without [S(−)] serum for 12 h and were then treated with 10 nm T3 for 30 min. Whole-cell lysates were subjected to Western blot analysis using antibodies directed against phospho-AMPK α-subunit (pT172), AMPK α-subunit (total), phospho-ACC (pS79), and actin. Most experiments were performed in duplicate cultures. Similar results were obtained from separate experiments. In densitometric analysis, the phospho-AMPK and phospho-ACC levels were normalized to the actin levels and expressed as percentages of the levels in T3-treated N2aTRα cells. Results are means ± sd (n = 4). *, P < 0.05 vs. the levels in S(+) cells; #, P < 0.05 vs. the levels in S(−) cells. B, N2aTRα cells cultured without serum for 12 h [S(−)] were treated with 10 nm T3 or 10 μm oligomycin for 30 min. Immunocytochemical analysis was performed using rabbit anti-phospho-AMPK α-subunit (pT172) antibody and antirabbit IgG antibody conjugated to Alexa Fluor 488 (green fluorescence). Propidium iodide staining was performed to identify nuclei (red fluorescence). Representative images are shown. Quantitative data on the amounts of phospho-AMPK in the cytoplasm are also presented. Several images were randomly captured, and the cytoplasmic signal densities were determined by Multi Gauge software on the LAS-1000 system. The values are expressed in arbitrary units, means ± sd (n = 20). *, P < 0.05 vs. S(−). Similar results were obtained from separate experiments. C, The mRNA levels of TRα and TRβ1 in wild-type N2a, N2aTRα, and N2aTRβ cells were determined by RT-PCR. N2aTRα and N2aTRβ cells are stable transformants expressing chicken TRα1 and human TRβ1, respectively. The PCR products were subjected to agarose gel electrophoresis and visualized by ethidium bromide.