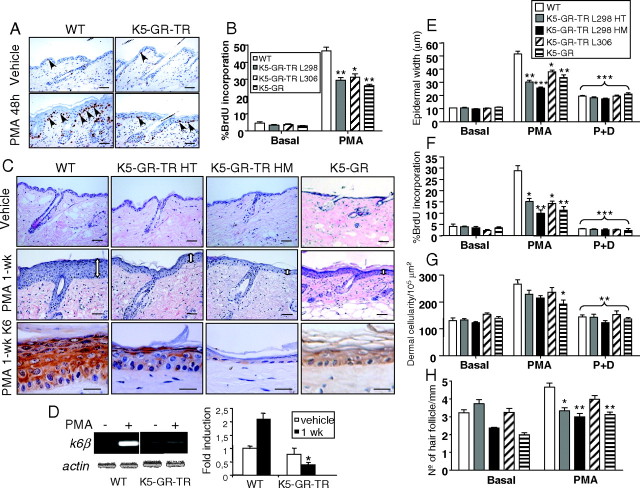
Fig. 4.
GR-TR Inhibits PMA-Induced Proliferation upon Acute and Chronic Treatment.
A and B, Responses of adult K5-GR-TR and K5-GR to acute PMA treatment. Age-matched adult WT, K5-GR-TR HT mice of lines 298 and 306, and K5-GR mice (line 285) were used for these experiments. The proliferation rate of interfollicular epidermal keratinocytes was evaluated in dorsal skin paraffin sections from the indicated genotypes, as indicated in Materials and Methods. Arrows indicate BrdU-positive interfollicular keratinocytes. Results of the quantification were graphed as the percentage of positive BrdU keratinocytes vs. total nuclei. Mean values ± sd are shown (n = 5). Asterisks denote statistically significant differences relative to PMA-treated WT mice, as determined by Student’s t test (*, P < 0.05; **, P < 0.005). C, Responses of adult K5-GR-TR and K5-GR mice to chronic PMA (1 wk). Age-matched adult WT, K5-GR-TR HT and HM mice of line 298, and K5-GR mice (line 285) were used for these experiments. Hematoxylin and eosin staining shows dramatic epidermal hyperplasia in WT mice that was greatly reduced in HT and HM skin as well as in K5-GR mice. K6 staining was evaluated as a marker of hyperproliferative skin. Bar, 50 μm except for K6 immunostaining, where the bar represents 25 μm. D, Determination of the mRNA levels of k6β by RT-PCR in WT and K5-GR-TR HM skin that was treated with either vehicle (−) or PMA for 1 wk. Experiments were performed in at least three individuals of each genotype. Quantitation of RT-PCR is shown at right. Mean values ± sd are shown (n = 3), and statistically significant differences (P < 0.05) are indicated by asterisks. E–H, Responses of adult K5-GR-TR and K5-GR to PMA (1 wk) and PMA plus Dex (1 wk) (P+D). Age-matched adult WT, K5-GR-TR HT and HM mice of line 298, K5-GR-TR mice of line 306, and K5-GR mice (line 285) were used for these experiments. Morphometric analyses were performed to determine epidermal width (E), dermal cellularity (G), and number of HFs per millimeter (H) in mouse skin of the indicated genotypes. Percentage of BrdU incorporation was also examined in the same skin samples (F). Note that the inhibition of epidermal keratinocyte growth correlated with transgene dosage (compare HT vs. HM) and was consistently observed in the two independent transgenic lines (298 and 306). Morphometric and BrdU measurements were performed in at least five individuals of each genotype. Mean values ± sd are shown. Asterisks indicate statistical significance of the response of each genotype as compared with PMA-treated WT mice, as determined by Student’s t test (*, P < 0.05; **, P < 0.005; ***, P < 0.0005).

