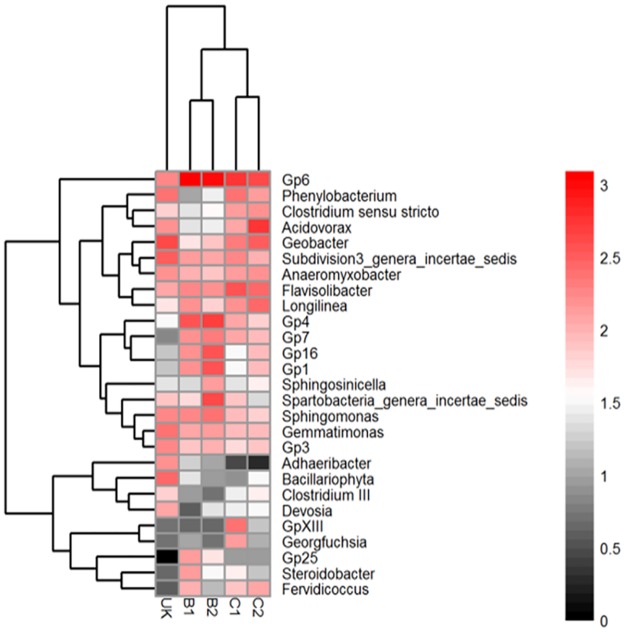
Fig 4. Heatmap of the 10 most abundant genera in each soil.
The 10 most abundant genera in each sample were selected (a total of 27 genera for all five soils), and their abundances were compared to those in other soils. The color intensity in each cell shows the percentage of a genus in a soil. See Fig 1 caption for the soil codes.

