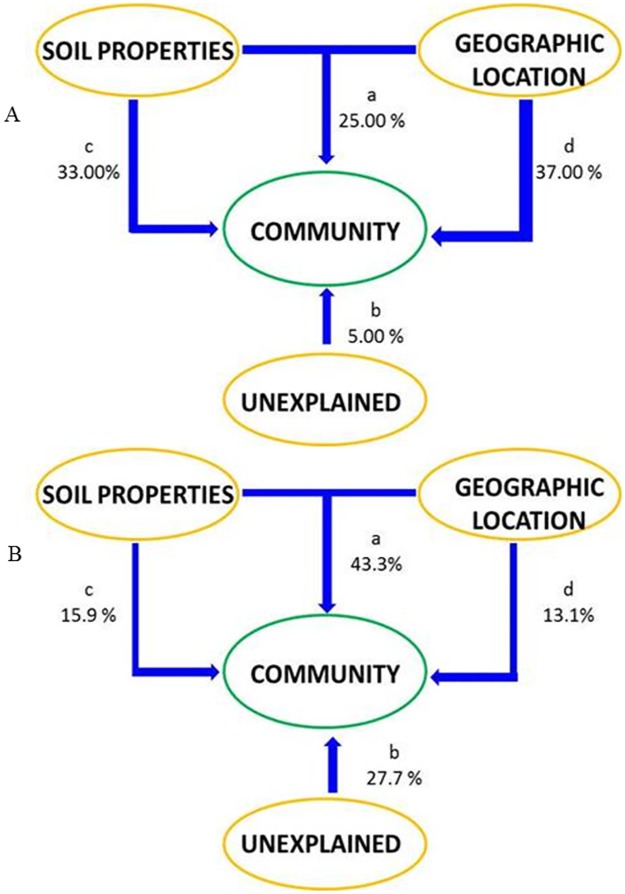
Fig 5. Variation partitioning analyses of As functional genes (A) and microbial community (B) explained by the soil selected properties and geographic locations.
The diagram represents the biological variation partitioned into the relative effects of each factor or a combination of factors, in which arrow thickness was proportional to the respective percentages of explained variation. Letter ′a′represents the combined effect of soil properties and geographic location. Letter ′b′represents the effect that could not be explained by any of the variables tested. And letters ′c′ and ′d′ represent the effect of soil properties and geographic location, respectively.

