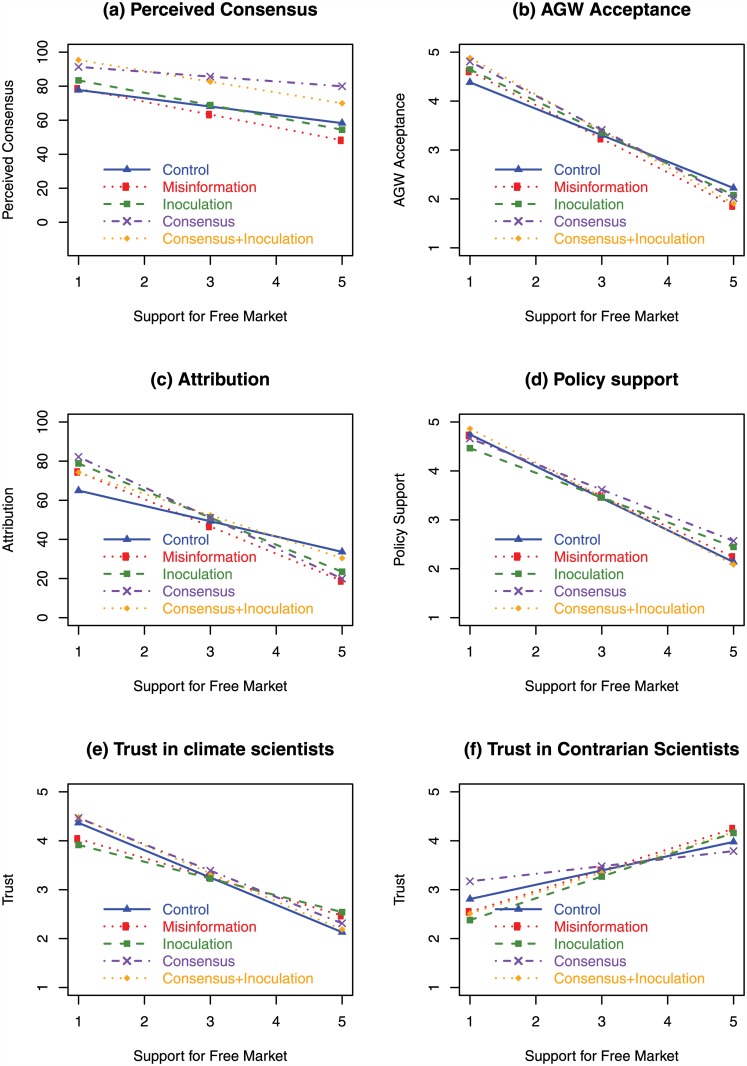
Fig 1. Predicted response in Experiment 1 from linear regression of observed data.
Blue solid line with triangles represents control group, red dotted line with circles represents group receiving misinformation only, green dashed line with squares represents group receiving inoculation before misinformation, purple dot-dashed line with crosses represents group receiving consensus information before misinformation, orange dotted line with diamonds represent group receiving consensus plus inoculation information before misinformation. Horizontal axis represents free-market support where 5 corresponds to strong agreement with unregulated markets. (a) Perceived scientific consensus on AGW. (b) AGW acceptance. (c) Attribution of human activity to climate trends. (d) Policy support. (e) Trust in climate scientists. (f) Trust in contrarian scientists.

